Table of Contents
body common control
{
version => "1.2.3";
inputs => { "$(sys.libdir)/stdlib.cf" };
bundlesequence => { "SetRootPassword" };
}
bundle common g
{
vars:
"secret_keys_dir" string => "/tmp";
}
bundle agent SetRootPassword
{
vars:
# Or get variables directly from server with Enterprise
"remote-passwd" string => remotescalar("rem_password","127.0.0.1","yes");
# Test this on a copy
files:
"/var/cfengine/ppkeys/rootpw.txt"
copy_from => secure_cp("$(sys.fqhost)-root.txt","master_host.example.org");
# or $(pw_class)-root.txt
"/tmp/shadow"
edit_line => SetRootPw;
}
bundle edit_line SetRootPw
{
vars:
# Assume this file contains a single string of the form root:passwdhash:
# with : delimiters to avoid end of line/file problems
"pw" int => readstringarray("rpw","$(sys.workdir)/ppkeys/rootpw.txt",
"#[^\n]*",":","1","200");
field_edits:
"root:.*"
# Set field of the file to parameter
edit_field => col(":","2","$(rpw[root][1])","set");
}
bundle server passwords
{
vars:
# Read a file of format
#
# classname: host1,host2,host4,IP-address,regex.*,etc
#
"pw_classes" int => readstringarray("acl","$(g.secret_keys_dir)/classes.txt",
"#[^\n]*",":","100","4000");
"each_pw_class" slist => getindices("acl");
access:
"/secret/keys/$(each_pw_class)-root.txt"
admit => splitstring("$(acl[$(each_pw_class)][1])" , ":" , "100"),
ifencrypted => "true";
}
bundle agent allow_ssh_rootlogin_from_authorized_keys(user,sourcehost)
{
vars:
"local_cache" string => "/var/cfengine/ssh_cache";
"authorized_source" string => "/master/CFEngine/ssh_keys";
files:
"$(local_cache)/$(user).pub"
comment => "Copy public keys from a an authorized cache into a cache on localhost",
perms => mo("600","root"),
copy_from => remote_cp("$(authorized_source)/$(user).pub","$(sourcehost)"),
action => if_elapsed("60");
"/root/.ssh/authorized_keys"
comment => "Edit the authorized keys into the user's personal keyring",
edit_line => insert_file_if_no_line_matching("$(user)","$(local_cache)/$(user).pub"),
action => if_elapsed("60");
}
bundle agent allow_ssh_login_from_authorized_keys(user,sourcehost)
{
vars:
"local_cache" string => "/var/cfengine/ssh_cache";
"authorized_source" string => "/master/CFEngine/ssh_keys";
files:
"$(local_cache)/$(user).pub"
comment => "Copy public keys from a an authorized cache into a cache on localhost",
perms => mo("600","root"),
copy_from => remote_cp("$(authorized_source)/$(user).pub","$(sourcehost)"),
action => if_elapsed("60");
"/home/$(user)/.ssh/authorized_keys"
comment => "Edit the authorized keys into the user's personal keyring",
edit_line => insert_file_if_no_line_matching("$(user)","$(local_cache)/$(user).pub"),
action => if_elapsed("60");
}
bundle edit_line insert_file_if_no_line_matching(user,file)
{
classes:
"have_user" expression => regline("$(user).*","$(this.promiser)");
insert_lines:
!have_user::
"$(file)"
insert_type => "file";
}
JSON is a well-known data language. It even has a specification (See http://json.org).
YAML is another well-known data language. It has a longer, much more complex specification (See http://yaml.org).
CFEngine has core support for JSON and YAML. Let's see what it can do.
We'd like to read, access, and merge JSON-sourced data structures: they should be weakly typed, arbitrarily nested, with consistent quoting and syntax.
We'd like to read, access, and merge YAML-sourced data structures just like JSON-sourced, to keep policy and internals simple.
In addition, we must not break backward compatibility with CFEngine
3.5 and older, so we'd like to use the standard CFEngine array a[b]
syntax.
A new data type, the data container, was introduced in 3.6.
It's simply called data. The documentation with some examples is at https://cfengine.com/docs/master/reference-promise-types-vars.html#data-container-variables
There are many ways to read JSON data; here are a few:
readjson(): read from a JSON file, e.g. "mydata" data => readjson("/my/file", 100k);parsejson(): read from a JSON string, e.g. "mydata" data => parsejson('{ "x": "y" }');data_readstringarray() and data_readstringarrayidx(): read text data from a file, split it on a delimiter, and make them into structured data.mergedata(): merge data containers, slists, and classic CFEngine arrays, e.g. "mydata" data => mergedata(container1, slist2, array3);mergedata in particular is very powerful. It can convert a slist or a classic CFEngine array to a data container easily: "mydata" data => mergedata(myslist);
There are two ways to read YAML data:
readyaml(): read from a YAML file, e.g. "mydata" data => readyaml("/my/file.yaml", 100k);parseyaml(): read from a YAML string, e.g. "mydata" data => parseyaml('- arrayentry1');Since these functions return data containers, everything about JSON-sourced data structures applies to YAML-sourced data structures as well.
To access JSON data, you can use:
nth() function to access an array element, e.g. "myx" string => nth(container1, 0);nth function to access a map element, e.g. "myx" string => nth(container1, "x");a[b] notation, e.g. "myx" string => "$(container1[x])";. You can nest, e.g. a[b][c][0][d]. This only works if the element is something that can be expanded in a string. So a number or a string work. A list of strings or numbers works. A key-value map under x won't work.getindices() and getvalues() functions, just like classic CFEngine arraysThis example can be saved and run. It will load a key-value map where the keys are class names and the values are hostname regular expressions or class names.
c or b or the classes c or b are defined, the dev class will be definedflea or the class flea is defined, the prod class will be defineda or the class a is defined, the qa class will be definedlinux or the class linux is defined, the private class will be definedEasy, right?
body common control
{
bundlesequence => { "run" };
}
bundle agent run
{
vars:
"bykey" data => parsejson('{ "dev": ["c", "b"], "prod": ["flea"], "qa": ["a"], "private": ["linux"] }');
"keys" slist => getindices("bykey");
classes:
# define the class from the key name if any of the items under the key match the host name
"$(keys)" expression => regcmp("$(bykey[$(keys)])", $(sys.host));
# define the class from the key name if any of the items under the key are a defined class
"$(keys)" expression => classmatch("$(bykey[$(keys)])");
reports:
"keys = $(keys)";
"I am in class $(keys)" ifvarclass => $(keys);
}
So, where's the magic? Well, if you're familiar with classic CFEngine
arrays, you will be happy to hear that the exact same syntax works
with them. In other words, data containers don't change how you use
CFEngine. You still use getindices to get the keys, then iterate
through them and look up values.
Well, you can change
"bykey" data => parsejson('{ "dev": ["c", "b"], "prod": ["flea"], "qa": ["a"], "private": ["linux"] }');
with
"bykey" data => data_readstringarray(...);
and read the same container from a text file. The file should be formatted like this to produce the same data as above:
dev c b
prod flea
qa a
private linux
You can also use
"bykey" data => readjson(...);
and read the same container from a JSON file.
Using JSON and YAML from CFEngine is easy and does not change how you use CFEngine. Try it out and see for yourself!
Prototype: irange(arg1, arg2)
Return type: irange
Description: Define a range of integer values for CFEngine internal use.
Used for any scalar attribute which requires an integer range. You can
generally interchangeably say "1,10" or irange("1","10"). However, if
you want to create a range of dates or times, you must use irange() if you
also use the functions ago(), now(), accumulated(), etc.
Arguments:
Example:
irange("1","100");
irange(ago(0,0,0,1,30,0), "0");
Symptom:
After the policy server was restarted with the new IP address, clients would not connect:
error: Not authorized to trust public key of server '192.168.14.113' (trustkey = false)
error: Authentication dialogue with '192.168.14.113' failed
Bootstrapping the clients also fails:
[root@dev /var/cfengine] /var/cfengine/bin/cf-agent --bootstrap 192.168.14.113
2014-06-23T13:57:07-0400 notice: R: This autonomous node assumes the role of voluntary client
2014-06-23T13:57:07-0400 notice: R: Failed to copy policy from policy server at 192.168.14.113:/var/cfengine/masterfiles
Please check
* cf-serverd is running on 192.168.14.113
* network connectivity to 192.168.14.113 on port 5308
* masterfiles 'body server control' - in particular allowconnects, trustkeysfrom and skipverify
* masterfiles 'bundle server' -> access: -> masterfiles -> admit/deny
It is often useful to restart cf-serverd in verbose mode (cf-serverd -v) on 192.168.14.113 to diagnose connection issues.
When updating masterfiles, wait (usually 5 minutes) for files to propagate to inputs on 192.168.14.113 before retrying.
2014-06-23T13:57:07-0400 notice: R: Did not start the scheduler
2014-06-23T13:57:07-0400 error: Bootstrapping failed, no input file at '/var/cfengine/inputs/promises.cf' after bootstrap
Solution:
Assuming that 661df12c960af9afdde093e0cb339b4d is the MD5 hostkey and
192.168.14.113 is the new IP address:
[root@hub]# cd /var/cfengine/ppkeys && mv -i root-MD5=661df12c960af9afdde093e0cb339b4d.pub root-192.168.14.113.pub
Prototype: readdata(filename, filetype)
Return type: data
Description: Parses CSV, JSON, or YAML data from file filename
and returns the result as a data variable.
When filetype is auto, the file type is guessed from the extension
(ignoring case): .csv means CSV; .json means JSON; .yaml or .yml means
YAML. If the file doesn't match any of those names, JSON is used.
When filetype is CSV,JSON,YAML or ENV,
this function behaves like readcsv(), readjson(), readyaml() or readenvfile() respectively.
These functions have an optional parameter maxbytes (default: inf).
maxbytes can not be set using readdata(), if needed use one of the mentioned functions instead.
Arguments:
filename: string, in the range: "?(/.*)filetype: one of
CSVYAMLJSONENVautoExample:
Prepare:
echo -n 1,2,3 > /tmp/file.csv
echo -n '{ "x": 200 }' > /tmp/file.json
echo '- a' > /tmp/file.yaml
echo '- b' >> /tmp/file.yaml
Run:
bundle agent main
{
vars:
"csv" data => readdata("/tmp/file.csv", "auto"); # or file type "CSV"
"json" data => readdata("/tmp/file.json", "auto"); # or file type "JSON"
"csv_str" string => format("%S", csv);
"json_str" string => format("%S", json);
feature_yaml:: # we can only test YAML data if libyaml is compiled in
"yaml" data => readdata("/tmp/file.yaml", "auto"); # or file type "YAML"
"yaml_str" string => format("%S", yaml);
reports:
"From /tmp/file.csv, got data $(csv_str)";
"From /tmp/file.json, got data $(json_str)";
feature_yaml::
"From /tmp/file.yaml, we would get data $(yaml_str)";
!feature_yaml:: # show the output anyway
'From /tmp/file.yaml, we would get data ["a","b"]';
}
Output:
R: From /tmp/file.csv, got data [["1","2","3"]]
R: From /tmp/file.json, got data {"x":200}
R: From /tmp/file.yaml, we would get data ["a","b"]
See also: readcsv(), readyaml(), readjson(), readenvfile(), data documentation.
History: Was introduced in 3.7.0.
Prototype: ifelse(...)
Return type: string
Description: Evaluate each pair of arguments up to the last one as a (class, value) tuple, returning value if class is set.
If none are set, returns the last argument.
Arguments:
The ifelse function is like a multi-level if-else statement. It was
inspired by Oracle's DECODE function. It must have an odd number of
arguments (from 1 to N). The last argument is the default value, like
the else clause in standard programming languages. Every pair of
arguments before the last one are evaluated as a pair. If the first
one evaluates true then the second one is returned, as if you had used
the first one in a class expression. So the first item in the pair
can be more than just a class name, it's a whole context like
Tuesday.linux.!verbose)
Generally, if ifelse were called with arguments (a1, a2, b1,
b2, c), the behavior expressed as pseudo-code is:
if a1 then return a2
else-if b1 then return b2
else return c
(But again, note that any odd number of arguments is supported.)
The ifelse function is extremely useful when you want to avoid
explicitly stating the negative of all the expected cases; this
problem is commonly seen like so:
class1.class2::
"myvar" string => "x";
class3.!class2::
"myvar" string => "y";
!((class1.class2)||class3.!class2)::
"myvar" string => "z";
That's hard to read and error-prone (do you know how class2 will
affect the default case?). Here's the alternative with ifelse:
"myvar" string => ifelse("class1.class2", "x",
"class3.!class2", "y",
"z");
Example:
bundle agent example
{
classes:
"myclass" expression => "any";
"myclass2" expression => "any";
"secondpass" expression => "any";
vars:
# we need to use the secondpass class because on the first pass,
# myclass and myclass2 are not defined yet
secondpass::
# result: { "1", "single string parameter", "hardclass OK", "bundle class OK", "5 parameters OK" }
"mylist" slist => {
ifelse(1),
ifelse("single string parameter"),
ifelse("cfengine", "hardclass OK", "hardclass broken"),
ifelse("myclass.myclass2", "bundle class OK", "bundle class broken"),
ifelse("this is not true", "5 parameters broken",
"this is also not true", "5 parameters broken 2",
"5 parameters OK"),
};
reports:
"ifelse result list: $(mylist)";
}
Note: As a general rule function evaluation is skipped when undefined variables are used. However this function has special behavior when exactly three arguments are used, allowing it to be evaluated even if it contains undefined variables. For example:
bundle agent example
{
vars:
"passwd_path"
string => ifelse( isvariable("def.passwd_path"), "$(def.passwd_path)",
"/etc/passwd"),
comment => "Use the user provided path for the passwd file if its defined
in the def scope, else use a sane default. This can allow for
easier policy testing and default overrides.";
}
History:
3.7.4 and 3.9.1.Run the following commands as root on the command line:
export AOUT_BIN="a.out"
export GCC_BIN="/usr/bin/gcc"
export RM_BIN="/bin/rm"
export WORK_DIR=$HOME
export CFE_FILE1="test_plain_1.txt"
export CFE_FILE2="test_plain_2.txt"
/var/cfengine/bin/cf-agent /var/cfengine/masterfiles/file_test.cf --bundlesequence robot,global_vars,packages,create_aout_source_file,create_aout,test_delete,do_files_exist_1,create_file_1,outer_bundle_1,copy_a_file,do_files_exist_2,list_file_1,stat,outer_bundle_2,list_file_2
Here is the order in which bundles are called in the command line above (some other support bundles are contained within file_test.cf but are not included here):
reports.Demonstrates use of reports, using an ascii art representation of the CFEngine robot.
Sets up some global variables that are used frequently by other bundles.
bundle common global_vars
{
vars:
"gccexec" string => getenv("GCC_BIN",255);
"rmexec" string => getenv("RM_BIN",255);
"aoutbin" string => getenv("AOUT_BIN",255);
"workdir" string => getenv("WORK_DIR",255);
"aoutexec" string => "$(workdir)/$(aoutbin)";
"file1name" string => getenv("CFE_FILE1",255);
"file2name" string => getenv("CFE_FILE2",255);
"file1" string => "$(workdir)/$(file1name)";
"file2" string => "$(workdir)/$(file2name)";
classes:
"gclass" expression => "any";
}
Ensures that the gcc package is installed, for later use by the create_aout bundle.
bundle agent packages
{
vars:
"match_package" slist => {
"gcc"
};
packages:
"$(match_package)"
package_policy => "add",
package_method => yum;
reports:
gclass::
"Package gcc installed";
"*********************************";
}
Creates the c source file that will generate a binary application in create_aout.
bundle agent create_aout_source_file
{
# This bundle creates the source file that will be compiled in bundle agent create_aout.
# See that bunlde's comments for more information.
vars:
# An slist is used here instead of a straight forward string because it doesn't seem possible to create
# line endings using \n when using a string to insert text into a file.
"c" slist => {"#include <stdlib.h>","#include <stdio.h>","#include <sys/stat.h>","#include <string.h>","void main()","{char file1[255];strcpy(file1,\"$(global_vars.file1)\");char file2[255];strcpy(file2,\"$(global_vars.file2)\");struct stat time1;int i = lstat(file1, &time1);struct stat time2;int j = lstat(file2, &time2);if (time1.st_mtime < time2.st_mtime){printf(\"Newer\");}else{if(time1.st_mtim.tv_nsec < time2.st_mtim.tv_nsec){printf(\"Newer\");}else{printf(\"Not newer\");}}}"};
files:
"$(global_vars.workdir)/a.c"
perms => system,
create => "true",
edit_line => Insert("@(c)");
reports:
"The source file $(global_vars.workdir)/a.c has been created. It will be used to compile the binary a.out, which will provide more accurate file stats to compare two files than the built in CFEngine functionality for comparing file stats, including modification time. This information will be used to determine of the second of the two files being compared is newer or not.";
"*********************************";
}
This bundle creates a binary application from the source in create_aout_source_file that uses the stat library to compare two files, determine if the modified times are different, nd whether the second file is newer than the first.
The difference between this application and using CFEngine's built in support for getting file stats is that normally the accuracy is only to the second of the modified file time but in order to better compare two files requires parts of a second as well. The stat library provides the extra support for retrieving the additional information required.
bundle agent create_aout
{
classes:
"doesfileacexist" expression => fileexists("$(global_vars.workdir)/a.c");
"doesaoutexist" expression => fileexists("$(global_vars.aoutbin)");
vars:
# Removes any previous binary
"rmaout" string => execresult("$(global_vars.rmexec) $(global_vars.aoutexec)","noshell");
doesfileacexist::
"compilestr" string => "$(global_vars.gccexec) $(global_vars.workdir)/a.c -o $(global_vars.aoutexec)";
"gccaout" string => execresult("$(compilestr)","noshell");
reports:
doesfileacexist::
"gcc output: $(gccaout)";
"Creating aout using $(compilestr)";
!doesfileacexist::
"Cannot compile a.out, $(global_vars.workdir)/a.c does not exist.";
doesaoutexist::
"The binary application aout has been compiled from the source in the create_aout_source_file bundle. It uses the stat library to compare two files, determine if the modified times are different, and whether the second file is newer than the first. The difference between this application and using CFEngine's built in support for getting file stats (e.g. filestat, isnewerthan), which provides file modification time accurate to a second. However, in order to better compare two files might sometimes require parts of a second as well. The stat library provides the extra support for retrieving the additional information required to get better accuracy (down to parts of a second), and is utilized by the binary application a.out that is compiled within the create_aout bundle.";
"*********************************";
}
Deletes any previous copy of the test files used in the example.
bundle agent test_delete
{
files:
"$(global_vars.file1)"
delete => tidy;
}
Verifies whether the test files exist or not.
bundle agent do_files_exist_1
{
classes:
"doesfile1exist" expression => fileexists("$(global_vars.file1)");
"doesfile2exist" expression => fileexists("$(global_vars.file2)");
methods:
doesfile1exist::
"any" usebundle => delete_file("$(global_vars.file1)");
doesfile2exist::
"any" usebundle => delete_file("$(global_vars.file2)");
reports:
!doesfile1exist::
"$(global_vars.file1) does not exist.";
doesfile1exist::
"$(global_vars.file1) did exist. Call to delete it was made.";
!doesfile2exist::
"$(global_vars.file2) does not exist.";
doesfile2exist::
"$(global_vars.file2) did exist. Call to delete it was made.";
}
Creates the first test file, as an empty file.
bundle agent create_file_1
{
files:
"$(global_vars.file1)"
perms => system,
create => "true";
reports:
"$(global_vars.file1) has been created";
}
Adds some text to the first test file.
bundle agent outer_bundle_1
{
files:
"$(global_vars.file1)"
create => "false",
edit_line => inner_bundle_1;
}
Makes a copy of the test file.
bundle agent copy_a_file
{
files:
"$(global_vars.file2)"
copy_from => local_cp("$(global_vars.file1)");
reports:
"$(global_vars.file1) has been copied to $(global_vars.file2)";
}
Verifies that both test files exist.
bundle agent do_files_exist_2
{
methods:
"any" usebundle => does_file_exist($(global_vars.file1));
"any" usebundle => does_file_exist($(global_vars.file2));
}
Reports the contents of each test file.
bundle agent list_file_1
{
methods:
"any" usebundle => file_content($(global_vars.file1));
"any" usebundle => file_content($(global_vars.file2));
reports:
"*********************************";
}
bundle agent exec_aout
{
classes:
"doesaoutexist" expression => fileexists("$(global_vars.aoutbin)");
vars:
doesaoutexist::
"aout" string => execresult("$(global_vars.aoutexec)","noshell");
reports:
doesaoutexist::
"*********************************";
"$(global_vars.aoutbin) determined that $(global_vars.file2) is $(aout) than $(global_vars.file1)";
"*********************************";
!doesaoutexist::
"Executable $(global_vars.aoutbin) does not exist.";
}
Compares the modified time of each test file using the binary application compiled in create_aout to see if it is newer.
bundle agent stat
{
classes:
"doesfile1exist" expression => fileexists("$(global_vars.file1)");
"doesfile2exist" expression => fileexists("$(global_vars.file2)");
vars:
doesfile1exist::
"file1" string => "$(global_vars.file1)";
"file2" string => "$(global_vars.file2)";
"file1_stat" string => execresult("/usr/bin/stat -c \"%y\" $(file1)","noshell");
"file1_split1" slist => string_split($(file1_stat)," ",3);
"file1_split2" string => nth("file1_split1",1);
"file1_split3" slist => string_split($(file1_split2),"\.",3);
"file1_split4" string => nth("file1_split3",1);
"file2_stat" string => execresult("/usr/bin/stat -c \"%y\" $(file2)","noshell");
"file2_split1" slist => string_split($(file2_stat)," ",3);
"file2_split2" string => nth("file2_split1",1);
"file2_split3" slist => string_split($(file2_split2),"\.",3);
"file2_split4" string => nth("file2_split3",1);
methods:
"any" usebundle => exec_aout();
reports:
doesfile1exist::
"Parts of a second extracted extracted from stat for $(file1): $(file1_split4). Full stat output for $(file1): $(file1_stat)";
"Parts of a second extracted extracted from stat for $(file2): $(file2_split4). Full stat output for $(file2): $(file2_stat)";
"Using the binary Linux application stat to compare two files can help determine if the modified times between two files are different. The difference between the stat application using its additional flags and using CFEngine's built in support for getting and comparing file stats (e.g. filestat, isnewerthan) is that normally the accuracy is only to the second of the file's modified time. In order to better compare two files requires parts of a second as well, which the stat command can provide with some additional flags. Unfortunately the information must be extracted from the middle of a string, which is what the stat bundle accomplishes using the string_split and nth functions.";
"*********************************";
!doesfile1exist::
"stat: $(global_vars.file1) and probably $(global_vars.file2) do not exist.";
}
Modifies the text in the second file.
bundle agent outer_bundle_2
{
files:
"$(global_vars.file2)"
create => "false",
edit_line => inner_bundle_2;
}
Uses filestat and isnewerthan to compare the two test files to see if the second one is newer. Sometimes the modifications already performed, such as copy and modifying text, happen too quickly and filestat and isnewerthan may both report that the second test file is not newer than the first, while the more accurate stat based checks in the stat bundle (see step 12) will recognize the difference.
bundle agent list_file_2
{
methods:
"any" usebundle => file_content($(global_vars.file1));
"any" usebundle => file_content($(global_vars.file2));
classes:
"ok" expression => isgreaterthan(filestat("$(global_vars.file2)","mtime"),filestat("$(global_vars.file1)","mtime"));
"newer" expression => isnewerthan("$(global_vars.file2)","$(global_vars.file1)");
reports:
"*********************************";
ok::
"Using isgreaterthan+filestat determined that $(global_vars.file2) was modified later than $(global_vars.file1).";
!ok::
"Using isgreaterthan+filestat determined that $(global_vars.file2) was not modified later than $(global_vars.file1).";
newer::
"Using isnewerthan determined that $(global_vars.file2) was modified later than $(global_vars.file1).";
!newer::
"Using isnewerthan determined that $(global_vars.file2) was not modified later than $(global_vars.file1).";
}
body common control {
inputs => {
"libraries/cfengine_stdlib.cf",
};
}
bundle agent robot
{
reports:
" 77777777777";
" 77777777777777";
" 777 7777 777";
" 7777777777777";
" 777777777777";
" 777 7777 77";
" ";
" ZZZZ ZZZ ZZZZ ZZZ ZZZZ";
" ZZZZZ ZZZZZZZZZZZZZZ ZZZZZ ";
" ZZZZZZZ ZZZZZZZZZZZZZ ZZZZZZZ";
" ZZZZ ------------- ZZZZZZ";
" ZZZZZ !CFENGINE! ZZZZZ";
" ZZZZ ------------- ZZZZZ";
" ZZZZZ ZZZZZZZZZZZZZZ ZZZZZ";
" ZZZ ZZZZZZZZZZZZZ ZZZ";
" ZZZZZ ZZZZZZZZZZZZZ ZZZZZ";
" ..?ZZZ+,,,,, ZZZZZZZZZZZZZZ ZZZZZ";
" ...ZZZZ~ ,:: ZZZZZZZZZZZZZ ZZZZ";
" ..,ZZZZZ,:::::: ZZZZZ";
" ZZZ ZZZ";
" ~ ===+";
" ZZZZZZZZZZZZZI??";
" ZZZZZZZZZZZZZ$???";
" 7Z$+ ZZ ZZZ???II";
" ZZZZZ+ ZZZZZIIII";
" ZZZZZ ZZZZZ III77";
" +++ +$ZZ??? ZZZ";
" +++??ZZZZZIIIIZZZZZ";
" ????ZZZZZIIIIZZZZZ";
" ??IIZZZZ 7777ZZZ";
" IIZZZZZ 77ZZZZZ";
" I$ZZZZ $ZZZZ";
}
bundle common global_vars
{
vars:
"gccexec" string => getenv("GCC_BIN",255);
"rmexec" string => getenv("RM_BIN",255);
"aoutbin" string => getenv("AOUT_BIN",255);
"workdir" string => getenv("WORK_DIR",255);
"aoutexec" string => "$(workdir)/$(aoutbin)";
"file1name" string => getenv("CFE_FILE1",255);
"file2name" string => getenv("CFE_FILE2",255);
"file1" string => "$(workdir)/$(file1name)";
"file2" string => "$(workdir)/$(file2name)";
classes:
"gclass" expression => "any";
}
bundle agent packages
{
vars:
"match_package" slist => {
"gcc"
};
packages:
"$(match_package)"
package_policy => "add",
package_method => yum;
reports:
gclass::
"Package gcc installed";
"*********************************";
}
bundle agent create_aout_source_file
{
# This bundle creates the source file that will be compiled in bundle agent create_aout.
# See that bunlde's comments for more information.
vars:
# An slist is used here instead of a straight forward string because it doesn't seem possible to create
# line endings using \n when using a string to insert text into a file.
"c" slist => {"#include <stdlib.h>","#include <stdio.h>","#include <sys/stat.h>","#include <string.h>","void main()","{char file1[255];strcpy(file1,\"$(global_vars.file1)\");char file2[255];strcpy(file2,\"$(global_vars.file2)\");struct stat time1;int i = lstat(file1, &time1);struct stat time2;int j = lstat(file2, &time2);if (time1.st_mtime < time2.st_mtime){printf(\"Newer\");}else{if(time1.st_mtim.tv_nsec < time2.st_mtim.tv_nsec){printf(\"Newer\");}else{printf(\"Not newer\");}}}"};
files:
"$(global_vars.workdir)/a.c"
perms => system,
create => "true",
edit_line => Insert("@(c)");
reports:
"The source file $(global_vars.workdir)/a.c has been created. It will be used to compile the binary a.out, which will provide more accurate file stats to compare two files than the built in CFEngine functionality for comparing file stats, including modification time. This information will be used to determine of the second of the two files being compared is newer or not.";
"*********************************";
}
bundle edit_line Insert(name)
{
insert_lines:
"$(name)";
}
bundle agent create_aout
{
classes:
"doesfileacexist" expression => fileexists("$(global_vars.workdir)/a.c");
"doesaoutexist" expression => fileexists("$(global_vars.aoutbin)");
vars:
# Removes any previous binary
"rmaout" string => execresult("$(global_vars.rmexec) $(global_vars.aoutexec)","noshell");
doesfileacexist::
"compilestr" string => "$(global_vars.gccexec) $(global_vars.workdir)/a.c -o $(global_vars.aoutexec)";
"gccaout" string => execresult("$(compilestr)","noshell");
reports:
doesfileacexist::
"gcc output: $(gccaout)";
"Creating aout using $(compilestr)";
!doesfileacexist::
"Cannot compile a.out, $(global_vars.workdir)/a.c does not exist.";
doesaoutexist::
"The binary application aout has been compiled from the source in the create_aout_source_file bundle. It uses the stat library to compare two files, determine if the modified times are different, and whether the second file is newer than the first. The difference between this application and using CFEngine's built in support for getting file stats (e.g. filestat, isnewerthan), which provides file modification time accurate to a second. However, in order to better compare two files might sometimes require parts of a second as well. The stat library provides the extra support for retrieving the additional information required to get better accuracy (down to parts of a second), and is utilized by the binary application a.out that is compiled within the create_aout bundle.";
"*********************************";
}
bundle agent test_delete
{
files:
"$(global_vars.file1)"
delete => tidy;
}
bundle agent delete_file(fname)
{
files:
"$(fname)"
delete => tidy;
reports:
"Deleted $(fname)";
}
body contain del_file
{
useshell => "useshell";
}
bundle agent do_files_exist_1
{
classes:
"doesfile1exist" expression => fileexists("$(global_vars.file1)");
"doesfile2exist" expression => fileexists("$(global_vars.file2)");
methods:
doesfile1exist::
"any" usebundle => delete_file("$(global_vars.file1)");
doesfile2exist::
"any" usebundle => delete_file("$(global_vars.file2)");
reports:
!doesfile1exist::
"$(global_vars.file1) does not exist.";
doesfile1exist::
"$(global_vars.file1) did exist. Call to delete it was made.";
!doesfile2exist::
"$(global_vars.file2) does not exist.";
doesfile2exist::
"$(global_vars.file2) did exist. Call to delete it was made.";
}
bundle agent create_file_1
{
files:
"$(global_vars.file1)"
perms => system,
create => "true";
reports:
"$(global_vars.file1) has been created";
}
bundle agent outer_bundle_1
{
files:
"$(global_vars.file1)"
create => "false",
edit_line => inner_bundle_1;
}
bundle agent copy_a_file
{
files:
"$(global_vars.file2)"
copy_from => local_cp("$(global_vars.file1)");
reports:
"$(global_vars.file1) has been copied to $(global_vars.file2)";
"*********************************";
}
bundle agent do_files_exist_2
{
methods:
"any" usebundle => does_file_exist($(global_vars.file1));
"any" usebundle => does_file_exist($(global_vars.file2));
}
bundle agent does_file_exist(filename)
{
vars:
"filestat" string => filestat("$(filename)","mtime");
classes:
"fileexists" expression => fileexists("$(filename)");
reports:
fileexists::
"$(filename) exists. Last Modified Time = $(filestat).";
!fileexists::
"$(filename) does not exist";
}
bundle agent list_file_1
{
methods:
"any" usebundle => file_content($(global_vars.file1));
"any" usebundle => file_content($(global_vars.file2));
reports:
"*********************************";
}
bundle agent exec_aout
{
classes:
"doesaoutexist" expression => fileexists("$(global_vars.aoutbin)");
vars:
doesaoutexist::
"aout" string => execresult("$(global_vars.aoutexec)","noshell");
reports:
doesaoutexist::
"*********************************";
"$(global_vars.aoutbin) determined that $(global_vars.file2) is $(aout) than $(global_vars.file1)";
"*********************************";
!doesaoutexist::
"Executable $(global_vars.aoutbin) does not exist.";
}
bundle agent stat
{
classes:
"doesfile1exist" expression => fileexists("$(global_vars.file1)");
"doesfile2exist" expression => fileexists("$(global_vars.file2)");
vars:
doesfile1exist::
"file1" string => "$(global_vars.file1)";
"file2" string => "$(global_vars.file2)";
"file1_stat" string => execresult("/usr/bin/stat -c \"%y\" $(file1)","noshell");
"file1_split1" slist => string_split($(file1_stat)," ",3);
"file1_split2" string => nth("file1_split1",1);
"file1_split3" slist => string_split($(file1_split2),"\.",3);
"file1_split4" string => nth("file1_split3",1);
"file2_stat" string => execresult("/usr/bin/stat -c \"%y\" $(file2)","noshell");
"file2_split1" slist => string_split($(file2_stat)," ",3);
"file2_split2" string => nth("file2_split1",1);
"file2_split3" slist => string_split($(file2_split2),"\.",3);
"file2_split4" string => nth("file2_split3",1);
methods:
"any" usebundle => exec_aout();
reports:
doesfile1exist::
"Parts of a second extracted extracted from stat for $(file1): $(file1_split4). Full stat output for $(file1): $(file1_stat)";
"Parts of a second extracted extracted from stat for $(file2): $(file2_split4). Full stat output for $(file2): $(file2_stat)";
"Using the binary Linux application stat to compare two files can help determine if the modified times between two files are different. The difference between the stat application using its additional flags and using CFEngine's built in support for getting and comparing file stats (e.g. filestat, isnewerthan) is that normally the accuracy is only to the second of the file's modified time. In order to better compare two files requires parts of a second as well, which the stat command can provide with some additional flags. Unfortunately the information must be extracted from the middle of a string, which is what the stat bundle accomplishes using the string_split and nth functions.";
"*********************************";
!doesfile1exist::
"stat: $(global_vars.file1) and probably $(global_vars.file2) do not exist.";
}
bundle agent outer_bundle_2
{
files:
"$(global_vars.file2)"
create => "false",
edit_line => inner_bundle_2;
}
bundle edit_line inner_bundle_1
{
vars:
"msg" string => "Helloz to World!";
insert_lines:
"$(msg)";
reports:
"inserted $(msg) into $(global_vars.file1)";
}
bundle edit_line inner_bundle_2
{
replace_patterns:
"Helloz to World!"
replace_with => hello_world;
reports:
"Text in $(global_vars.file2) has been replaced";
}
body replace_with hello_world
{
replace_value => "Hello World";
occurrences => "all";
}
bundle agent list_file_2
{
methods:
"any" usebundle => file_content($(global_vars.file1));
"any" usebundle => file_content($(global_vars.file2));
classes:
"ok" expression => isgreaterthan(filestat("$(global_vars.file2)","mtime"),filestat("$(global_vars.file1)","mtime"));
"newer" expression => isnewerthan("$(global_vars.file2)","$(global_vars.file1)");
reports:
"*********************************";
ok::
"Using isgreaterthan+filestat determined that $(global_vars.file2) was modified later than $(global_vars.file1).";
!ok::
"Using isgreaterthan+filestat determined that $(global_vars.file2) was not modified later than $(global_vars.file1).";
newer::
"Using isnewerthan determined that $(global_vars.file2) was modified later than $(global_vars.file1).";
!newer::
"Using isnewerthan determined that $(global_vars.file2) was not modified later than $(global_vars.file1).";
}
bundle agent file_content(filename)
{
vars:
"file_content" string => readfile( "$(filename)" , "0" );
"file_stat" string => filestat("$(filename)","mtime");
reports:
"Contents of $(filename) = $(file_content). Last Modified Time = $(file_stat).";
#"The report on contents will only show new content and modifications. Even if the method is called more than once, if the evaluation is exactly the same as the previous call then there will be no report (possibly because the bundle is not evaluated a second time?).";
}
body perms system
{
mode => "0640";
}
We intuitively recognize agility as the capability to respond rapidly enough and flexibly enough to a difficult challenge. If we imagine an animal surviving in the wild, a climber on a rock-face or a wrestler engaged in combat, we identify the skills of anticipation, speed of response and the ability to adapt or bend without breaking to meet the challenges.
In infrastructure management, agility represents the need to handle changing demand for service, to repair an absence of service, and to improve and deploy new services in response to changes from users and market requirements. It is tied to economic, business or work-related imperatives by the need to maintain a competitive lead.
The compelling event that our system must respond to might represent danger, or merely a self-imposed deadline. In either case, there is generally a penalty associated with a lack of agility: a blow, a fall or a loss.
To understand agility, we have to understand time and the capacity for change. Agility is a relative concept: it's about adapting quickly enough, in the right context, with the right measure and in the right way. Below, we'll try to gain an engineering perspective on agility to see what enables it and what throttles it.
To respond to a challenge there are four stages that need attention:
Each of these phases takes actual clock-time and requires a certain flexibility. Our goal is to keep these phases simple and therefore cheap for the long-term. Affording the time and flexibility needed is the key to being agile. Technology can help with this, if we adopt sound practices.
Intuitively, we understand agility to be related to our capacity to respond to a situation. Let's try to pin this idea down more precisely.
The capacity of a system is defined to be its maximum rate of change. Most often, this refers to speed of the system response to a single request1.
In engineering, capacity is measured in changes per second, so it represents the maximum speed of a system within a single thread of activity2.
Speed is the rate at which change takes place. For a configuration tool like CFEngine, speed can be measured either as
Clock speed
The actual elapsed wall-clock time-rate at which work gets done, including any breaks and pauses in the schedule.
This depends on how often checks are made, or the interval between them, e.g. in CFEngine, the default schedule is to verify promises every five minutes.
System speed
The average speed of the system when it is actually busy working on a problem, excluding breaks and pauses. For example, once CFEngine has been scheduled at the end of a five minute interval, it might take a few seconds to make necessary changes.
Engineers can try to define an engineering scale of agility as the ratio of available speed to required speed and ratio of number ways a system can be changed to the number of ways imperatives require us to change.
Agility is proportional to both how much speed we can muster compared to what is required, and the number of change-capabilities we possess, compared to what we need to meet a challenge. In other words: how well equipped are we? As engineers, we could write something like this:
Available speed under control Changes available
Agility =~ ----------------------------- * -----------------------
Required speed Changes Required
Although such a scale might be hard to measure and follow in practice, the definition makes simple engineering sense3, and brings some insight into what we need to think about. What it suggests is that agility is a combination of speed and precision.
What is required speed? It is is the rate of change we have to be able to enact in order to achieve and maintain a state (keep a promise) that is aligned with our intent. This requires a dependence on technology and human processes.
The weakest link in any chain of dependencies limits the speed. The weakest link might be a human who doesn't understand what to do, or a broken wire or a misconfigured switch, so there are many possible failure modes for agility. An organization is an information rich society with complex interplays between Man and Machine; agility challenges us to think about these weakest links and try to bolster them with CFEngine's technology.
For example:
If we think in terms of services, it is the Service Level you have to achieve in order to comply with a Service Level Agreement.
If we think of a support ticket, it is the speed we have to work at in order to keep the impact of an unpredicted change within acceptable levels.
What we call /acceptable/ is a subjective judgement, i.e. a matter for policy to decide. So there are many uncertainties and relativisms in such definitions. It would be inconceivable to claim any kind of industry standard for these.

We can write some scaling laws for the dependencies of agility to see where the failure modes might arise.
The speed available to meet a challenge is (on average) the maximum speed we can reliably maintain over time divided by the number of challenges we have to share between.
Expected capacity * reliability
Average available speed =~ -------------------------------
Consumers or challenges
This expression says that the rate at which we get work done on average depends no only on how we share maximum capacity amongst a number of different consumers, clients, processes, etc, but also on how much of the time this capacity is fully available, perhaps because systems are down or unavailable.
The appearance of reliability in this expression therefore tells us that maintenance of the system, and anticipation of failure will play a key role in agility. Remarkably this is usually unexpected for most practitioners, and most of system planning goes into first time deployment, rather than maintaining operational state.
Acting quickly is not enough: we also need to be accurate in responding to change[4]. We need to be able to:
Model the desired outcome accurately in terms of universal policy coordinates: Why, When, Where, What, How.
Maximize the chance that the promised outcome will be achieved.
Precision is maximized when:
Changes are `precise', i.e. they can be made at a highly granular level, without disturbing areas that are not relevant (few side-effects).
Policy is able to model or describe the desired state accurately, i.e. within the relevant area, the state is within acceptable tolerances.
If any assumptions are hidden, they are describable in terms of the model, not determined by the limitations of the software5.
The agent executes the details of the model quickly and verifiably, in a partially unpredictable environment, i.e. it should be fault tolerant.
If the model cannot be implemented, it is possible to determine why and decide whether the problem lies in an incorrect assumption or a flaw in the implementation.
CFEngine is a fault tolerant system – it continues to work on what it can even when some parts of its model don't work out as expected[6].
Next: Efficiency, Previous: Precision, Up: Understanding Agility 1.5 Comprehension
The next challenge is concerns a human limitation. One of the greatest challenges in any organization lies in comprehending the system.
Comprehensibility increases if something is predictable, or steady in its behaviour, but it decreases in proportion to the number of things we need to think about – which includes the many different contexts such as environments, or groups of machines with different purposes or profiles.
Predictability (Reliability) Predictability
Comprehensibility =~ ---------------------------- = ---------------- Contexts Diversity
Our ability to comprehend behaviour depends on how predictable it is, i.e. how well it meets our expectations. For technology, we expect behaviour to be as close as possible on our intentions. CFEngine's maintenance of promises ensures that this is done with best possible effort and a rapid cycle of checking.
To keep the number of contexts to a minimum, CFEngine avoids mixing up what policy is being expressed with how the promises are kept. It uses a declarative language to separate the what from the how. This allows ordinary users to see what was intended without having to know the meaning of how, as was the case when scripting was used to configure systems.
Previous: Comprehension, Up: Understanding Agility 1.6 Efficiency
Finally, if we think about the efficiency of a configuration, which is another way of estimating its simplicity, we are interested in how much work it takes to represent our intentions. There are two ways we can think about efficiency: the efficiency of the automated process and the human efficiency in deploying it.
If the technology has a high overhead, the cost of maintaining change is high and efficiency is low:
The efficiency of the technology decreases with the more resources it uses, e.g. like memory and CPU. Resources used to run the technology itself are pure overhead and take away from the real work of your system.
Resources used
Resource Efficiency =~ 1 - ---------------
Total resources
It is a design goal of CFEngine to maintain minimal overhead in all situations. The second aspect of efficiency is how much planning or rule-making is needed to manage the relevant issues.
The efficiency of a model decreases when you put more effort into managing a certain number of things. If you can manage a large number of things with a few simple constraints, that is efficient.
Number of objects affected
Model Efficiency =~ -------------------------------
Number of rules and constraints
General patterns play a role too in simplifying, because the reduce the number of special rules and constraints down to fewer more generic rules. If we make good use of patterns, we can make few rules that cover many cases. If there are no discernible patterns, every special case is a costly exception. This affects not just the technology cost, but also the cognitive cost (i.e. the comprehensibility).
Efficiency therefore plays a role in agility, because it affects the cost of change. Greater efficiency generally means greater speed, and more greater likelihood for precision.
Next: Agility in your work, Previous: Understanding Agility, Up: Top 2 Aspects of CFEngine that bring agility
We can now summarize some qualities of CFEngine that favour agility:
Ability to express clear intentions about desired outcome (comprehension).
Availability of insight into system performance and state (comprehension).
Ability to manage large numbers of hosts and resources with a few generic patterns (efficiency).
Ability to bundle related details into simple containers (comprehension without loss of adaptability).
Ability to accurately customize policy down to a low level without programming (adaptability).
Ability to recover quickly from faults and failures. The default, parallelized execution framework verifies promises every 5 minutes for rapid fault detection and change deployment (clock speed)7 .
A quick system monitoring/sampling rate – every 2.5 minutes (Nyquist frequency), for automated hands-free response to errors.
Ability to recover cheaply. The lightweight resource footprint of CFEngine that consumes few system resources required for actual business (system speed – low overhead, maximum capacity).
Ability to increase number of clients without significant penalty (scalability and easy increase of capacity).
A single framework for all devices and operating systems (ease of migrating from one platform to another).
What agility means in different environments
Separating What from How
Packaging limits agility
How abstraction improves agility
Increasing system capacity - by scaling
Let's examine some example cases where agility plays a role. Agility only has meaning relative to an environment, so in the following sections, we cite the remarks of CFEngine users (in quotes), and their example environments.
Users' expectations for agility can differ dramatically in the present; but if we think just a few years down the line, and follow the trends, it seems clear that limber systems must prevail in IT's evolutionary jungle.
"The desktop space can be a very volatile environment, with multiple platforms."
Speed:
Speed is essential when there is a need to respond to a security threat that
affects all of the desktop systems; e.g. when dealing with malware that
requires the distribution of updated virus.dat files, etc. CFEngine can be
very helpful by automating the process of distributing and restarting the
application responsible for virus detection and mitigation. Systems that
have been breached, need to be returned to known and secure state quickly to
avoid loss. CFEngine can quickly detect and correct host based intrusions
using file-scanning techniques and can secure hosts for examination, or just
repair them quickly.
Another case for agility lies in user request processing. For example, when
a new user joins a workplace and needs resources such as desktop, laptop,
phone, Internet connection, VPN connection, VM instances, etc. Speed is of
the essence to minimize employee downtime.
Precision:
Desktop environments can involve many different platforms: Windows, multiple
flavours of Linux and Macintosh, etc. A uniform low-cost way of
`provisioning' and maintaining all of these, as well as responding to common
threats is of significant value.
Precision is important to ensure that the resources made available are
indeed the correct ones. Inaccuracy can be a potential security issue, or
merely a productivity question.
Precision also comes into play when an enterprise rolls out new patches or
productivity upgrades. These upgrades need to be uniformly and precisely
distributed to all of the desktop systems during a given change window. By
design, desktop clients running CFEngine automatically check for changes in
system state and can precisely propagate desired state. In the case of
system restoration due to corruption or hardware failure, CFEngine can
greatly reduce the time needed to return to the most current enterprise
build.
Modern web-based companies often base their entire financial operations around an active web site. Down-time of the web service is mission critical.
Speed:
The frequency of maintenance is not usually critical in web shops, since
configuration changes can be planned to occur over hours rather than
minutes. During software updates and system repairs, however, speed and
orchestration are issues, as time lost during upgrades is often revenue
lost, and a lack of coordination of multiple parts could cause effective
downtime.
It is therefore easy to scale the management of a web service, as change is
rarely considered to be time-critical.
Resource availability for the web service is an issue on busy web servers,
however web services are typically quite slow already and it is easy to load
balance a web service, so resource efficiency of the management software is
not usually considered a high priority, until the possible savings become
significant with thousands of hosts.
Credit card information is subject to PCI-DSS regulation and requires a
continuous verification for auditing purposes, but these systems are often
separated from the main web service. Speed of execution can be seen as an
advantage by some auditors where repairs to security matters and detection
of breaches are carefully monitored.
Precision:
The level of customization in a web shop could be quite high, as there is a
stack of interdependent services including databases and name services that
have to work seamlessly, and the rate of deployment of new versions of the
software might be relatively high.
Customization and individuality is a large part of a website's business
competitiveness. Maintaining precise
Speed:
The cloud was designed for shorter time-scales, and relatively quick
turnover of needs. That suggests that configuration will change quite often.
For Infrastructure-as-a-Service providers and consumers, set up and
tear-down rates are quite high so efficient and speedy configuration is
imperative.
Precision:
For Software and Platform as a service providers, stability, high
performance and regulation are key issues, and scaling up and down for
demand is probably the fastest rate of change.
High Performance clusters are typically found in the oil and gas industry, in movie, financial, weather and aviation industries, and any other modelling applications where raw computation is used to crunch numbers.
Speed:
The lightweight footprint of CFEngine is a major benefit here, as every CPU
cycle and megabyte of memory is precious, so workflow is not disrupted.
"A single node in the compute grid being out of sync with the others can
cause the entire grid to cause failed jobs or otherwise introduce
unpredictability into the environment, as it may produce results that differ
from its peers. Thus it is imperative that repairs to an incorrect state
happen as soon as possible, to minimize the impact of these issues."
Precision:
"Precision is exquisitely important in an HPC grid. When making a
configuration change, due to the homogeneity of the environment, small
changes can have enormous impacts due to the quantity of affected systems. I
liken this to the "monoculture" problem in replanted forests – everything is
the same, so what would ordinarily be a small, easily-contained problem like
a fungus outbreak, quickly spreads into an uncontrollable disaster. Thus,
with HPC systems it is imperative that any changes deployed are precise, to
ensure that no unintended consequences will occur. This is clearly directly
related to comprehensibility of the environment – it is difficult or
impossible to make a precise change when you don't fully comprehend the
environment."
Speed:
Government is not known for speed.
Precision:
"Government systems are reviewed and audited under FISMA and so one has
often thought in terms of the ability to reduce complexity to make the
problem manageable. Government typically wants the one-size-fits-all
solution to system management and could benefit from something that can
manage complexity and diversity while providing some central control (I bet
you hate that word). The only thing we might have in common with finance is
auditing but I'm sure the methods and goals are completely different.
Finance is big money trying to make more big money. Government is focused
more on compliance with its own regulations."
Speed:
One of the key factors in finance is liability. Fear of error, has led to
very slow processing of change.
High availability in CFEngine is used for continuous auditing and security.
Passing regulatory frameworks like SOX, SAS-70, ISO 20k, etc can depend on
this non-intrusive availability. Liability is a major concern and
significant levels of approval are generally required to make changes, with
tracking of individual responsibility. Out-of-hours change windows are
common for making upgrades and making intended changes. Scalability of
reporting is a key here, but change happens slowly.
Precision:
Security and hence tight control of approved software are major challenges
in government regulated institutions. Agility has been a low priority in the
past, but this will have to change as the rest of the world's IT services
accelerate.
SCADA (supervisory control and data acquisition) generally refers to industrial control systems (ICS): computer systems that monitor and control industrial, infrastructure, or facility-based processes, as described below.
Speed:
Manufacturing is a curious mix of all the mention areas and more. In
addition to the above, there is an tool component. The tools can design,
build, test, track, and ship a physical unit. Downtime of any component is
measured in missed revenue, so speed of detection and repair is crucial.
Precision:
"We need to ensure agility and accuracy of reporting. We need to know what
is going on at any microsecond of the day. One faulty tool can throw a
wrench in the whole works. The digital equivalent of the steam whistle to
stop the line.
From there, all the tool information is fed upstream to servers, from there
to databases, then reports, that statistical analysis, and so on. Each piece
needs to move with the product and incorporate it. It is a steady chain of
events where are all information is liquid and relevant.
Not only do you have the security requirements, from virus updates to top
secret classification, but these tools need to never stop, ever. Also, these
tools need constant reconfiguration depending on the product they are
working on: e.g. you can't use the same set of procedures on XBox chip as a
cellphone memory module. And all the tools are different too: one may be a
probe to detect microscopic fractures in the layers, one tool may just track
it's position in line. Supply and demand, cost and revenue."
If you have to designs a programmatic solution to a challenge, it will cost you highly in terms of cognitive investment, testing and clarity of purpose to future users. Thinkingprocess(how) instead ofknowledge(what) is a classic carry-over from the era of 2nd Wave industrialization8.
Think of CFEngine as an active knowledge management system, rather than as a relatively passive programming framework.
For `DevOps': programming is for your application, consider its deployment to be part of the documentation.
Many programmatic systems and APIs' force you to explain how something will be
accomplished and the statement aboutwhat' the outcome will be is left to an
implicit assumption. Such systems are called imperative systems.
CFEngine is a declarative system. In a declarative system, the reverse is true. You begin by writing down What you are trying to accomplish and the How is more implicit. The way this is done is by separating data from algorithm in the model. CFEngine encourages this with its language, but you can go even further by using the tools optimally.
CFEngine allows you to represent raw data as variables, or as strings within your policy. For example:
bundle agent name
{
vars:
"main_server" string => "abc.123.com";
"package_source[ubuntu]" string => "repository.ubuntu.com";
"package_source[suse]" string => "repository.suse.com";
# Promises that use these data
#
# packages:
# processes:
# files:
# services: , etc
}
By separating `what' data like this out of the details of how they are used, it becomes easier to comprehend and locate, and it becomes fast to change, and the accuracy of the change is easily perceived. Moreover, CFEngine can track the impact of such a change by seeing where the data are used.
CFEngine's knowledge management can tell you which system promises depend on which data in a clear manner, so you will know the impact of a change to the data.
You can also keep data outside your policy in databases, or sources like:
For example, reading in data from a system file is very convenient. This is what Unix-like system do for passwords and user management.
What you might lose when making an input matrix is the why. Is there an explanation that fits all these cases, or does each case need a special explanation? We recommend that you include as much information as possible about `why'.
Atomicity enables agility. Atomicity, or the avoidance of dependency, is a key approach to simplicity. Today this is often used to argue to packaging of software.
Handling software and system configuration as packages of data makes certain processes appear superficially easy, because you get a single object to deal with, that has a name and a version number. However, to maintain flexibility we should not bundle too many features into a package.
A tin of soup or a microwave meal might be a superficially easy way to make dinner, for many scenarios, but the day you get a visitor with special dietary requirements (vegetarian or allergic etc) then the prepackaging is a major obstacle to adapting: the recipe cannot be changed and repackaged without going back to the factory that made it. Thus oversimplification generally tends to end up sending up back to work around the technology.
CFEngine's modelling language gives you control over the smallest ingredients, but also allows you to package your own containers or work with other suppliers' packages. This ensures that adaptability is not sacrificed for superficial ease.
For example: your system's package model can cooperate with CFEngine make asking CFEngine to promise to work with the package manager:
bundle agent example
{
packages:
"apache2";
"php5";
"opera";
}
If you need to change what happens under the covers, it is very simple to do this in CFEngine. You can copy the details of the existing methods, because the details are not hard-coded, and you can make your own custom version quickly.
bundle agent example
{
packages:
"apache2"
package_method => my_special_package_manager_interface;
}
Abstraction allows us to turn special cases into general patterns. This leads to a compression of information, as we can make defaults for the general patterns, which do not have to be repeated each time.
Service promises are good example of this9, for example:
bundle agent example
{
services:
"wwww";
}
In this promise, all of the details of what happens to turn on the web service have been hidden behind this simple identifier ‘www’. This looks easy, but is it simple?
In this case, it is both easy and simple. Let's check why. We have to ask the question: how does this abstraction improve speed and precision in the long run?
Obviously, it provides short term ease by allowing many complex operations to take place with the utterance of just a single word10. But any software can pull that smoke and mirrors trick. To be agile, it must be possible to understand and change the details of what happens when this services is promised. Some tools hard-code processes for this kind of statement, requiring an understanding of programming in a development language to alter the result. In CFEngine, the definitions underlying this are written in the high-level declarative CFEngine language, using the same paradigm, and can therefore be altered by the users who need the promise, with only a small amount of work.
Thus, simplicity is assured by having consistency of interface and low cost barrier to changing the meaning of the definition.
Capacity in IT infrastructure is increased by increasing machine power. Today, at the limit of hardware capacity, this typically means increasing the number of machines serving a task. Cloud services have increased the speed agility with which resources can be deployed – whether public or private cloud – but they do not usually provide any customization tools. This is where CFEngine brings significant value.
The rapid deployment of new services is assisted by:
Virtualization hypervisor control or private cloud management (libvirt integration).
Rapid, massively-parallelized custom configuration.
Avoidance of network dependencies.
Related to capacity is the issue of scaling services for massive available capacity.
By scalability we mean the intrinsic capacity of a system to handle growth. Growth in a system can occur in three ways: by the volume of input the system must handle, in the total size of its infrastructure, and by the complexity of the processes within it.
For a system to be called scalable, growth should proceed unhindered, i.e. the size and volume of processing may expand without significantly affecting the average service level per node.
Although most of us have an intuitive notion of what scalability means, a full understanding of it is a very complex issue, mainly because there are so many factors to take into account. One factor that is often forgotten in considering scalability, is the human ability to comprehend the system as it grows. Limitations of comprehension often lead to over-simplification and lowest-common-denominator standardization.
Scalability is addressed in a separate document: Scale and Scalability, so we shall not discuss it further here.
Just as we separate goals from actions, and strategy from tactics, so we can separate what is easy from what is simple. Easy brings short-term gratification, but simple makes the future cost less.
Easyis about barriers to adoption. If there is a cost associated with moving ahead that makes it hard:
Simple is about what happens next. Once you have started, what happens if you want to change something?
Total cost of ownership is reduced if a design is simple, as there are only a few things to learn in total. Even if those things are hard to learn, it is a one-off investment and everything that follows will be easy.
Unlike some tools, with CFEngine, you do not need to program `how' to do things, only what you want to happen. This is always done by using the same kinds of declarations, based on the same model. You don't need to learn new principles and ideas, just more of the same.
In the past[11], it was common to manage change by making everything the same. Today, the individualized custom experience is what today's information-society craves. Being forced into a single mold is a hindrance to adaptability and therefore to agility. To put it another way, in the modern world of commerce, consumers rule the roost, and agility is competitive edge in a market of many more players than before.
Of course, it is not quite that simple. Today, we live in a culture of `ease', and we focus on what can be done easily (low initial investment) rather than worrying about long term simplicity (Total Cost of Ownership).
At CFEngine, we believe that easy' answers often suffer from the sin of
over-simplification, and can lead to risky practices. After all, anyone can make
something appear superficially easy by papering over a mess, or applying raw
effort, but this will not necessarily scale up cheaply over time. Moreover,
making a risky processtoo easy' can encourage haste and carelessness.
Any problem has an intrinsic complexity, which can be measured by the smallest amount of information required to manage it, without loss of control.
Ease is the absence of a barrier or cost to action.
Simplicity is a strategy for minimizing Total Cost of Ownership.
Making something truly simple is a very hard problem, but it is an investment in future change. What is easy today might be expensive to make easy tomorrow. But if something is truly simple, then the work is all up front in learning the basics, and does not come as an unexpected surprise down the line.
At CFEngine, we believe in agility through simplicity, and so we invest continuous research into making our technology genuinely simple for trained users. We know that a novice user will not necessarily find CFEngine easy, but after a small amount of training, CFEngine will be a tool for life, not just a hurried deployment.
Simplicity in CFEngine is addressed in the following ways:
The software has few dependencies that complicate installation and upgrading.
Changes made are atomic and minimize dependencies.
Each host works as an independent entity, reducing communication fragility.
The configuration model is based on Promise Theory – a very consistent and simple approach to modelling autonomous cooperative systems.
All hosts run the same software agents on all operating platforms (from mobile phones to mainframes), and understand a single common language of intent, which they can translate into native system calls. So there are few exceptions to deal with.
Comprehensive facilities are allowed for making use of patterns and other total-information-reducing tactics.
A certain level of complexity might be necessary and desirable – complexity is relative. Some organizations still try to remain agile by avoiding complexity. However, the ability to respond to complex scenarios often requires us to dabble with diversity. Avoiding it merely creates a lack of agility, as one is held back by the need to over-simplify.
All configuration issues, including fitness for purpose, boil down to three
things: why, what and how. Knowing why we do something is the most important way
of avoiding error and risk of failure. Simplicity then comes from keeping the
what' and thehow' separate, and reducing the how to a predictable, repairable
transaction. This is what CFEngine'sconvergent promisetechnology does.
Knowledge is an antidote to uncertainty. Insight into patterns, brings simplicity to the information management, and insight into behaviour allows us to estimate impact of change, thus avoiding the risk associated with agility.
In configuration what' represents transitory knowledge, whilehow' is often
more lasting and can be absorbed into the infrastructure. The consistency and
repairability of `how' makes it simpler to change what without risk.
Agility allows companies and public services to compete and address the needs of
continuous service improvement. This requires insight into IT operations from
business and vice versa. Recently, the DevOps' movement in web arenas has
emphasized the need for a more streamlined approach to integrating
business-driven change and IT operations. Whatever we choose to call this, and
in whatever arena,connecting the dots between business and IT' is a major
enabler for agility to business imperatives.
Some business issues are inherently complex, e.g. software customization and security, because they introduce multifaceted conflicts of interest that need to resolved with clear documentation about why.
Be careful about choosing a solution because it has a low initial outlay cost. Look to the long term cost, or the Total Cost of Ownership over the next 5 years.
Many businesses have used the argument: everything is getting cheaper so it doesn't matter if my software is inefficient – I can brute force it in a year's time with more memory and a faster CPU. The flaw in this argument is that complexity and scale are also increasing, and you will need those savings down the line even more than you do now.
The ability to model our intentions in a clearly understandable way enables insight and understanding; this, in turn, allows us to anticipate and comprehend challenges. CFEngine's knowledge management features help to make the configuration itself a part of the documentation of the system. Instead of relying on command line tools to interact, the user documents intentions (as `promises to be kept'). These promises, and how well they have been kept, can be examined either from the original specification or in the Mission Portal.
In the industrial age, the strategy was to supply sufficient force to a small
problem in order to control' it by brute force. In systems today the scale and
complexity are such that no such brute force approach can seriously be expected
to work. Thus one is reduced to a more even state of affairs: learning to work
with the environmentas is', with clear expectations of what is possible and
controlling only certain parts on which crucial things depend.
CFEngine is designed to have a low Total Cost of Ownership, by being exceptionally lightweight and conceptually simple. The investment in CFEngine is a `learning curve' that some find daunting. Indeed, at CFEngine, we work on reducing this initial learning curve all the time – but what really saves you in the end is simplicity without over-simplification.
At a deployment in the banking sector, CFEngine replaced an incumbent software solution where 200 machines were required to make the management infrastructure scale to the task.
CFEngine replaced this with 3 machines, and a reduced workforce. After the replacement the clock-time required for system updates went from 45 minutes to 16 seconds.
The total cost of providing for agility can be costly or it can be cheap. By design, CFEngine aims to make scale and agility inexpensive in the long run.
The bottom line is: you are! Diversity and customization are basic freedoms that user-driven services demand in today's world, and having the agility to meet changing desires is going to be an increasingly important and prominent feature of IT, as we delve further into the information-based society.
Competitive edge, response to demands, in both private sector and research, makes agility the actual product of a not-too-distant tomorrow.
Who or what makes agility a reality? The simple answer to this question is everyone and everything. Change is a chain of dependent activities and the weakest link in the chain is the limiting factor. Often, that is human knowledge, since it is the part of the chain that we take most for granted.
CFEngine has been carefully designed to support agile operations for the long term, by investing in knowledge management, speed and efficiency.
Footnotes
[1]: Capacity is often loosely referred to as `bandwidth' because of its connection to signal propagation in communication science, but this is not strictly correct, as bandwidth refers to parallel channels.
[2]: For example, for a single coding frequency, the capacity of a communications channel is measured in bits per second, and the bandwidth is the number multiplied by the number of parallel frequencies.
[3]: If available speed matches need, and we have the capability to make all required changes, then we can claim exactly 100% agility. If we have less than required, then we get a smaller number, and if we have excess speed or changeability then we can even claim a super-efficiency.
[4]: In the 20th century, science learned that there is no such thing as determinism – the idea that you can guarantee an outcome absolutely. If you still think in such terms, you will be quickly disappointed. The best we can accomplish is to maximize the likelihood of a predictable result, relative to the kind of environment in which we work.
[5]: In some other configuration software, assumptions are hard-coded into the tools themselves, making the outcome undocumented.
[6]: Other systems that claim to be deterministic simply stop with error messages. What is the correct behaviour? Clearly, this is a subjective choice. The important thing is that your system for change behaves in a predictable way.
[7]: Two related concepts that are frequently referred to are the classic reliability measures: Mean Time Before Failure (MTBF) or proactive health and Mean Time To Repair (MTTR), speed of recovery: (i) If we are proactive or quick at recovering from minor problems, larger outages can be avoided. Recovery agility plays a role in avoiding cascade failure. (ii) If the time to repair is long, or the repair is inaccurate, this could result if more widespread problems. Inaccurate change or repair often leads to attempts to `roll-back', causing further problems.
[8]: See http://www.cfengine.com/blog/sysadmin-3.0-and-the-third-wave
[9]: Service promises, as described here, were introduced into version 3.3.0 of CFEngine in 2012.
[10]: All good magic stories begin like this.
[11]: Perhaps not just in the past. We are emerging from an industrial era of management where mass producing everything the same was the cheapest approach to scaling up services. However, today personal freedom demands variety and will not tolerate such oversimplification.
New in CFEngine Learn about the newest features in CFEngine 3.12
Supported Platforms and Versions These are the supported platforms for the current release.
Known Issues View any issues of which we are currently aware and investigating. View possible workarounds.
This guide describes how to install CFEngine on two Red Hat® Enterprise Linux® (RHEL) virtual machines using Amazon Web Services™ (AWS) and SSH. At the time of writing, under certain conditions, setting up an AWS account and using micro-instances is free.
One of the two machines will be a policy server, while the other will be a host.
Although these instructions walk through the steps needed to install CFEngine Enterprise on two machines, up to 25 machines can be set up using the same procedure and scripts.
This tutorial will cover the following steps:
Create Instance click on Launch Instance.Red Hat Enterprise Linux 64 Bit Free tier eligible press the Select button.Choose Instance Type screen ensure the Micro Instances tab on the left is selected.Next: Configure Instance Details.Configure Instance Details screen change the number of instances to 2.Network as the default.Subnet can be No preference.Public IP is checked.Review and Launch.Security group name on the Review Instance Launch screen.Launch.Create a new key pair in the first drop down menu.Key pair name.Download Key Pair button and save the .pem file to your local computer.Launch Instance button.Launch Status screen click the View Instances button.NETWORK & SECURITY > Security GroupsSecurity group name from earlier, click on the appropriate line item in the list.Inbound tab.+Add Rule button. Select HTTP from the drop-down list. Click "Add Rule" button again.Custom TCP rule and enter 5308 in the Port range text entry. Select "Custom IP" from the drop-down menu in the "Source" column.See: Quick-Start Guide to Using PuTTY
sudo yum install system-config-firewall to install.The following steps are only necessary for one of the two virtual machines, the one that is designated as the policy server; these steps can be omitted on the second (client machine). Note that CFEngine refers to a client machine by the name Host:
sudo system-config-firewallFirewall Configuration screen use the Tab key to go to Customize.Enter key. Below is the Firewall Configuration window that comes up: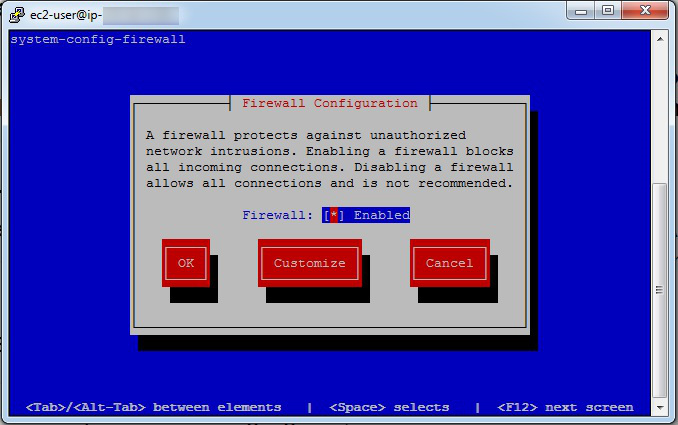
Trusted Services screen, scroll down to WWW (HTTP), AKA port 80.Space Bar to toggle the WWW entry (i.e. ensure it is on, showing an asterisk beside the name).Tab key again until Forward is highlighted, then hit Enter.Tab key until Add is highlighted, then hit Enter.5308 in the Port section.Tab key and enter tcp in the Protocol section.Tab key until OK is highlighted, and hit Enter.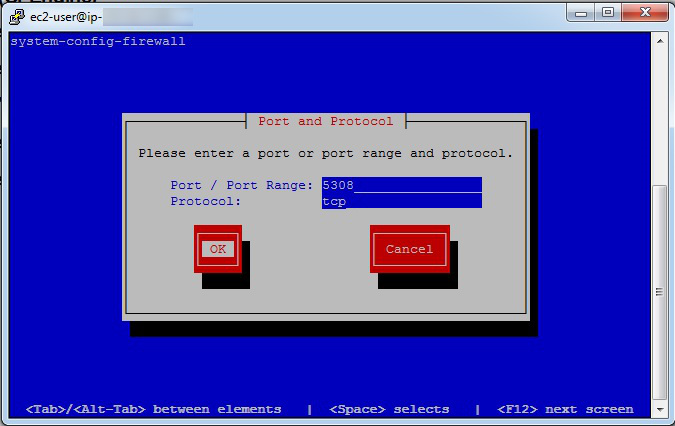
The Port and Protocol are entered in the blue boxes, with entries of 5308 and tcp respectively.
Then the Tab key is used to highlight the OK button, and the user presses Enter.
Tab key until Close is highlighted, and hit Enter.Tab key or arrow keys until OK is highlighted, and hit Enter.For the second virtual machine, which is the client machine (also called host), you may need to do the following if you see an error when bootstrapping this virtual machine in later steps:
* In the Firewall Configuration screen use the Tab key to go to Firewall.
* Turn off the firewall by toggling the entry with the Space bar.
Note: Turning off the firewall in a production environment is considered unsafe.
We ready now ready to install the CFEngine software on both the server and client virtual machines. These also referred to as the “hub” and “host” machines, respectively. During the course of the instructions outlined in this guide, you will perform the following tasks:
Run the following script on your designated Policy Server (hub), the virtual machine with the configured firewall from earlier steps:
$ wget https://s3.amazonaws.com/cfengine.packages/quick-install-cfengine-enterprise.sh && sudo bash ./quick-install-cfengine-enterprise.sh hub
This script installs the latest CFEngine Enterprise Policy Server on your server machine.
$ ifconfig.Run the bootstrap command: sudo /var/cfengine/bin/cf-agent --bootstrap <IP address of policy server>
Example: $ sudo /var/cfengine/bin/cf-agent --bootstrap 172.31.3.25
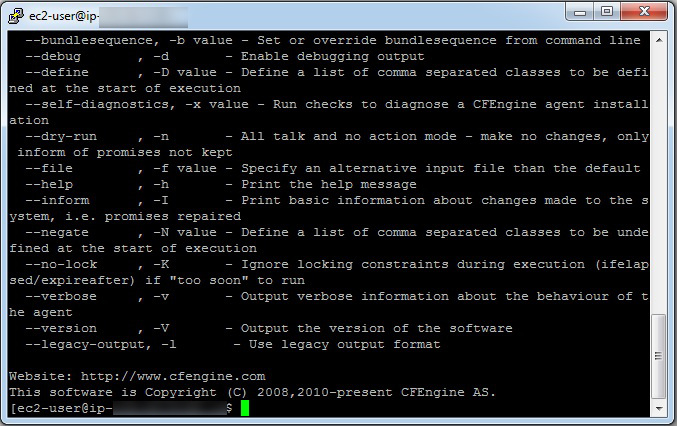
Upon successful completion, a confirmation message appears: "Bootstrap to '172.31.3.25' completed successfully!"
Type the following to check which version of CFEngine your are running:
/var/cfengine/bin/cf-promises --version
The Policy Server is now installed.
$ wget https://s3.amazonaws.com/cfengine.packages/quick-install-cfengine-enterprise.sh && sudo bash ./quick-install-cfengine-enterprise.sh agent
Note: The installation will work on 64-bit and 32-bit client machines (the host requires a 64-bit machine).
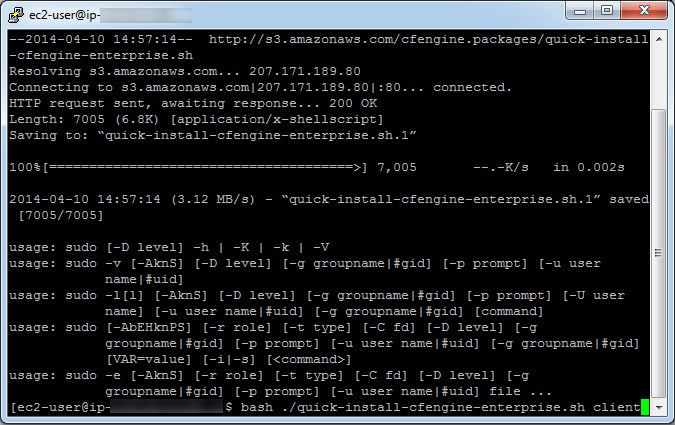
The client software (host), has been installed on the second virtual machine.
Note: You can install CFEngine Enterprise on up to 25 hosts using the script above.
Host and the Policy Server.Run the same commands that you ran in Step 2, $ sudo /var/cfengine/bin/cfagent bootstrap <IP address of policy server>.
Example: $ sudo /var/cfengine/bin/cfagent bootstrap 172.31.3.25
The installation process is complete and CFEngine Enterprise is up and running on your system.
admin, and the password is also admin.Distribute files from a central location.
Whereas the first tutorial in this list teaches you how to deploy business policy through the Mission Portal, this advanced, command-line tutorial shows you how to distribute policy files from the Policy Server to all pertinent Hosts.
This is a standalone policy that will restart three CFEngine processes if they are not running.
body common control
{
bundlesequence => { "process_restart" };
}
bundle agent process_restart
{
vars:
"component" slist => { # List of processes to monitor
"cf-monitord",
"cf-serverd",
"cf-execd"
};
processes:
"$(component)"
restart_class => canonify("start_$(component)"); # Set the class "start_<component>" if it is not running
commands:
"/var/cfengine/bin/$(component)"
ifvarclass => canonify("start_$(component)"); # Evaluate the class "start_<component>", CFEngine will run
# the command if "start_<component> is set.
}
Notes: The canonify function translates illegal characters to underscores, e.g. start_cf-monitord becomes start_cf_monitord. Only alphanumerics and underscores are allowed in CFEngine identifiers (names of variables, classes, bundles, etc.)
This policy can be found in /var/cfengine/share/doc/examples/unit_process_restart.cf.
Example run:
# ps -ef |grep cf-
root 4305 1 0 15:14 ? 00:00:02 /var/cfengine/bin/cf-execd
root 4311 1 0 15:14 ? 00:00:05 /var/cfengine/bin/cf-serverd
root 4397 1 0 15:15 ? 00:00:06 /var/cfengine/bin/cf-monitord
# kill 4311
# ps -ef |grep cf-
root 4305 1 0 15:14 ? 00:00:02 /var/cfengine/bin/cf-execd
root 4397 1 0 15:15 ? 00:00:06 /var/cfengine/bin/cf-monitord
# cf-agent -f unit_process_restart.cf
# ps -ef |grep cf-
root 4305 1 0 15:14 ? 00:00:02 /var/cfengine/bin/cf-execd
root 4397 1 0 15:15 ? 00:00:06 /var/cfengine/bin/cf-monitord
root 8008 1 0 18:18 ? 00:00:00 /var/cfengine/bin/cf-serverd
#
And again, in Inform mode:
# kill 8008
# cf-agent -f unit_process_restart.cf -I
2013-06-08T18:19:51-0700 info: This agent is bootstrapped to '192.168.183.208'
2013-06-08T18:19:51-0700 info: Running full policy integrity checks
2013-06-08T18:19:51-0700 info: /process_restart/processes/'$(component)': Making a one-time restart promise for 'cf-serverd'
2013-06-08T18:19:51-0700 info: Executing 'no timeout' ... '/var/cfengine/bin/cf-serverd'
2013-06-08T18:19:52-0700 info: Completed execution of '/var/cfengine/bin/cf-serverd'
#
When filtering an inventoried list item filtering can be based on one or more elements of the specific inventoried item. Note that when filtering for multiple elements of a list AND logic is used.
For example, this simple policy will inventory "My Inventory" with "common" and either "one" and "four" or "two" and "three".
bundle agent example
{
meta:
"tags" slist => { "autorun" };
vars:
!host_001::
"slist" slist => { "common", "one", "four" },
meta => { "inventory", "attribute_name=My Inventory" };
host_001::
"slist" slist => { "common", "two", "three" },
meta => { "inventory", "attribute_name=My Inventory" };
}
The above policy can produce inventory that looks like this:

Adding a filter where "My Inventory" matches or contains common AND one:

CFEngine takes a pragmatic point of view to ordering. When promising scalar
attributes and properties, ordering is irrelevant and should not be considered.
More complex patterned data structures require ordering to be preserved, e.g.
editing in files. CFEngine solves this in a two-part strategy:
CFEngine maintains a default order of promise-types. This is based on a simple
logic of what needs to come first, e.g. it makes no sense to create something
and then delete it, but it could make sense to delete and then create (an
equilibrium). This is called normal ordering and is described below. You can
override normal ordering in exceptional circumstances by making a promise in a
class context and defining that class based on the outcome of another promise,
or using the depends_on promise attribute.
CFEngine tries to keep variable and class promises before starting to consider any other kind of promise. In this way, global variables and classes can be set.
If you set variables based on classes that are determined by other variables, then you introduce an order dependence to the resolution that might be non-unique. Since CFEngine starts trying to converge values as soon as possible, it is best to define variables in bundles before using them, i.e. as early as possible in your configuration. In order to make sure all global variables and classes are available early enough policy pre-evaluation step was introduced.
CFEngine policy evaluation is done in several steps:
For more information regarding each step please see the detailed description below.
Before exact evaluation of promises takes place first command line parameters
are read and all classes defined using -D parameter are set. Next,
environment detection takes place and hard classes are discovered. When
environment detection is complete all the persistent classes are loaded and a
policy sanity check is performed using cf-promises.
In this step policy is validated and classes and vars promises are
evaluated. Note that cached functions are executed here, and then again during
the normal agent execution. Variables and classes resolved in this step do not
persist into the following evaluation step, so all functions will run again
during Agent pre-evaluation.
In order to support expansion of variables in body common control inputs and make sure all needed classes and variables are determined before they are needed in normal evaluation, pre-evaluation takes place immediately before policy evaluation.
During pre-evaluation files are loaded based on ordering in body common control (first) and body file control (after body common control). This means that files included in body common control are loaded and parsed before files placed in body file control. This is important from a common bundles evaluation perspective as bundles placed in files included in body common control inputs will be evaluated before bundles from file control inputs.
The following steps are executed per-bundle for each file parsed, in this order:
1. if it's a common bundle, evaluate vars promises
2. if it's a common bundle, evaluate classes promises
3. evaluate vars promises
(for details see PolicyResolve() in the C code)
This is done because classes placed in common bundles are global whereas classes placed in agent bundles are local (by default) to the bundle where those are defined. This means that common bundles classes need these extra steps in order to be resolved for the next steps.
After all policy files are parsed and pre-evaluated, the above pre-evaluation sequence runs once again in order to help resolve dependencies between classes and vars placed in different files.
After pre-evaluation is complete normal evaluation begins.
In this step CFEngine executes agent promise bundles in the strict order
defined by the bundlesequence (possibly overridden by the -b or
--bundlesequence command line option). If the bundlesequence is not provided
via command line argument or is not present in body common control agent will
attempt to execute a bundle named main. If bundle main is not defined, the
agent will error and exit.
Within a bundle, the promise types are executed in a round-robin fashion
according to so-called normal ordering (essentially deletion first, followed
by creation). The actual sequence continues for up to three iterations of the
following, converging towards a final state:
meta
vars
defaults
classes
users
files
packages
guest_environments
methods
processes
services
commands
storage
databases
reports
Within edit_line bundles in files promises,
the normal ordering is:
meta
vars
defaults
classes
delete_lines
field_edits
insert_lines
replace_patterns
reports
The order of promises within one of the above types follows their top-down
ordering within the bundle itself. In vars this can be used to override the
value of a variable, if you have two vars promises with the same name, the
last one will override the first one. The order may be overridden by making a
promise depend on a class that is set by another promise, or by using the
depends_on attribute in the promise.
Note: The evaluation order of common bundles are classes, then
variables and finally reports. All common bundles are evaluated regardless
if they are placed in bundlesequence or not. Placing common bundles in
bundlesequence will cause classes and variables to be evaluated again, and is
generally good practice to make sure evaluation works properly.
As with the agent, common bundles are executed before any server bundles;
following this all server bundles are executed (the bundlesequence is only
used for cf-agent). Within a server bundle, the promise types are unambiguous.
Variables and classes are resolved in the same way as the agent. On
connection, access control must be handled first, then a role request might be
made once access has been granted. Thus ordering is fully constrained by
process with no additional freedoms.
Within a server bundle, the normal ordering is:
vars
classes
roles
access
As with the agent, common bundles are executed before any monitor bundles;
following this all monitor bundles are executed (the bundlesequence is only
used for cf-agent). Variables and classes are resolved in the same way as the
agent.
Within a monitor bundle, the normal ordering is:
vars
classes
measurements
reports
CFEngine defines a number of variables for embedding unprintable values or values with special meanings in strings.
reports:
# This will report: The value of $(const.dollar) is $
"The value of $(const.dollar)(const.dollar) is $(const.dollar)";
# This will report: But the value of $(dollar) is $(dollar)
"But the value of $(dollar) is $(dollar)";
reports:
# On Unix hosts this will report: The value of $(const.dirsep) is /
# On Windows hosts this will report: The value of $(const.dirsep) is \\
"The value of $(const.dollar)(const.dirsep) is $(const.dirsep)";
reports:
"A newline with either $(const.n) or with $(const.endl) is ok";
"But a string with \n in it does not have a newline!";
reports:
"A newline with either $(const.n) or with $(const.endl) is ok";
"But a string with \n in it does not have a newline!";
reports:
"A carriage return character is $(const.r)";
reports:
"A report with a$(const.t)tab in it";
Changes REST API allows to track the changes made by cf-agent in the infrastructure.
This examples shows how to count changes performed by cf-agent within last 24h hours.
Example is searching for changes that are performed by linux machines within generate_repairs bundle.
Request
curl --user admin:admin 'https://test.cfengine.com/api/v2/changes/policy/count?include[]=linux&bundlename=generate_repairs'
Response
{
"count": 381
}
Show all vacuumdb executions within last 24 hours executed on policy server.
Example is searching for changes that are performed by policy_server machines that execute commands promise with command /var/cfengine/bin/vacuumdb% - there is '%' sign at the end which is a wildcard as vacuumdb is executed with different options across policy.
Request
curl --user admin:admin 'https://test.cfengine.com/api/v2/changes/policy?include[]=policy_server&promisetype=commands&promiser=/var/cfengine/bin/vacuumdb%'
Response
{
"data": [
{
"bundlename": "cfe_internal_postgresql_vacuum",
"changetime": 1437642099,
"hostkey": "SHA=6ddfd5eaa85ee681ec12ce833fd7206e4d21c76e496be5f8b403ad0ead60a6ce",
"hostname": "hub.provisioned.1436361289.cfengine.com.com",
"logmessages": [
"Executing 'no timeout' ... '/var/cfengine/bin/vacuumdb --analyze --quiet --dbname=cfdb'",
"Completed execution of '/var/cfengine/bin/vacuumdb --analyze --quiet --dbname=cfdb'"
],
"policyfile": "/var/cfengine/inputs/lib/cfe_internal_hub.cf",
"promisees": [],
"promisehandle": "cfe_internal_postgresql_maintenance_commands_run_vacuumdb",
"promiser": "/var/cfengine/bin/vacuumdb --analyze --quiet --dbname=cfdb",
"promisetype": "commands",
"stackpath": "/default/cfe_internal_management/methods/'CFEngine_Internals'/default/cfe_internal_enterprise_main/methods/'hub'/default/cfe_internal_postgresql_vacuum/commands/'/var/cfengine/bin/vacuumdb --analyze --quiet --dbname=cfdb'[0]"
}
],
"total": 1,
"next": null,
"previous": null
}
Prototype: string_mustache(template_string, optional_data_container)
Return type: string
Description: Formats a Mustache string template into a string, using either the system datastate() or an explicitly provided data container.
The usual Mustache facilities like conditional evaluation and loops are available, see the example below.
Example:
body common control
{
bundlesequence => { "config", "example" };
}
bundle agent config
{
vars:
"deserts" data => parsejson('{ "deserts": {
"Africa": "Sahara",
"Asia": "Gobi"
} }');
}
bundle agent example
{
vars:
# {{@}} is the current key during an iteration in 3.7 with Mustache
"with_data_container" string => string_mustache("from container: deserts = {{%deserts}}
from container: {{#deserts}}The desert {{.}} is in {{@}}. {{/deserts}}", "config.deserts");
# you can dump an entire data structure with {{%myvar}} in 3.7 with Mustache
"with_system_state" string => string_mustache("from datastate(): deserts = {{%vars.config.deserts.deserts}}
from datastate(): {{#vars.config.deserts.deserts}}The desert {{.}} is in {{@}}. {{/vars.config.deserts.deserts}}"); # will use datastate()
reports:
"With an explicit data container: $(with_data_container)";
"With the system datastate(): $(with_system_state)";
}
Output:
R: With an explicit data container: from container: deserts = {
"Africa": "Sahara",
"Asia": "Gobi"
}
from container: The desert Sahara is in Africa. The desert Gobi is in Asia.
R: With the system datastate(): from datastate(): deserts = {
"Africa": "Sahara",
"Asia": "Gobi"
}
from datastate(): The desert Sahara is in Africa. The desert Gobi is in Asia.
History: Introduced in CFEngine 3.7
See also: datastate(), readjson(), parsejson(), data.
Prototype: cfe_internal_management_file_control
Implementation:
bundle common cfe_internal_management_file_control
{
vars:
"inputs" slist => { };
cfengine_recommendations_enabled::
"input[cfengine_recommendations]"
string => "$(this.promise_dirname)/recommendations.cf";
any::
"inputs" slist => getvalues( input );
}
Prototype: cfe_internal_management
Implementation:
bundle agent cfe_internal_management
{
vars:
any::
"policy[cfe_internal_core_main]"
string => "cfe_internal_core_main",
comment => "Activate policies related to basic CFEngine operations";
enterprise_edition::
"policy[cfe_internal_enterprise_main]"
string => "cfe_internal_enterprise_main",
comment => "Activate policies related to CFEngine Enterprise operations";
# TODO: Scope this more tightly to mission portal role
enterprise_edition.policy_server::
"policy[cfe_internal_enterprise_mission_portal]"
string => "Activate policies related to CFEngine Enterprise Mission Portal";
any::
"bundles" slist => getindices(policy);
"recommendation_bundles"
slist => sort( bundlesmatching( "cfengine_recommendations" ), lex);
methods:
#
# CFEngine internals
#
"CFEngine_Internals"
usebundle => "$(bundles)";
"CFEngine Recommendations"
usebundle => $(recommendation_bundles),
if => isvariable( recommendation_bundles );
reports:
DEBUG|DEBUG_cfe_internal_management::
"DEBUG $(this.bundle): Should actuate $(bundles)";
}
Prototype: control
Implementation:
body file control
{
cfengine_recommendations_enabled::
inputs => { @(cfe_internal_management_file_control.inputs) };
}
The context connection is used by the shortcut attribute in access
promises to access information about the remote agent requesting access.
access:
"/var/cfengine/cmdb/$(connection.key).json"
shortcut => "me.json",
admit_keys => { "$(connection.key)" };
Note: The usage of the connection variables is strictly limited to
literal strings within the promiser and admit/deny lists of access promise
types; they cannot be passed into functions or stored in other variables. These
variables can only be used with incoming connections that use
protocol_version >=2 ( or "latest" ).
This variable contains the public key sha of the connecting client in the form 'SHA=...'.
access:
"/var/cfengine/cmdb/$(connection.key).json"
shortcut => "me.json",
admit_keys => { "$(connection.key)" };
This variable contains the IP address of the connecting remote agent.
access:
"/var/cfengine/cmdb/$(connection.ip).json"
shortcut => "myip.json",
admit_keys => { "$(connection.key)" };
This variable contains the hostname of the connecting client as determined by a
reverse DNS lookup from cf-serverd.
access:
"/var/cfengine/cmdb/$(connection.hostname).json"
shortcut => "myhostname.json",
admit_keys => { "$(connection.key)" };
Note: Reverse lookups are only performed when necessary. To avoid the
performance impact of reverse dns lookups for each connection avoid using
admit_hostnames, using hostnames in your admit rules, and these
connection variables.
Prototype: fileexists(filename)
Return type: boolean
Description: Returns whether the file filename can be accessed.
The file must exist, and the user must have access permissions to the file for this function to return true.
Notes:
fileexists() does not resolve symlinks. If a broken symlink exists, the
file is seen to exist. For this functionality use filestat("myfile", "link target")
to see if a file resolves to a the expected target, and check if the
link target exists. Alternatively use test with returnszero(), for example
returnszero("/bin/test -f myfile").Arguments:
filename: string, in the range: "?(/.*)Example:
body common control
{
bundlesequence => { "example" };
}
bundle agent example
{
classes:
# this.promise_filename has the currently-executed file, so it
# better exist!
"exists" expression => fileexists($(this.promise_filename));
"exists_etc_passwd" expression => fileexists("/etc/passwd");
reports:
exists::
"I exist! I mean, file exists!";
}
Output:
R: I exist! I mean, file exists!
See Also: filestat(), isdir(), islink(), isplain(), returnszero()
Scheduling refers to the execution of non-interactive processes or tasks (usually called `jobs') at designated times and places around a network of computers (see the Special Topics Guide on Scheduling). Distributed Scheduling refers to the chaining of different jobs into a coordinated workflow that spans several computers. For example, you schedule a processing job on machine1 and machine2, and when these are finished you need to schedule a job on machine3. This is distributed scheduling.
Dispatch is the term used for starting actually the execution of a job that has been scheduled. There are two ways to achieve distributed job scheduling:
Centralized dispatch of jobs.
Peer to peer signalling with local dispatch of jobs.
There are pros and cons to centralization. Centralization makes consistency easy to determine, but it creates bottlenecks in processing and allows one machine to see all information. Decentralization provides an automatic and natural load-balancing of job dispatch, and it allows machines to reveal information on a `need to know' basis.
CFEngine is a naturally decentralized system, and only policy definition is usually centralized, but you can set up practically any architecture you like, in a secure fashion.
You promise to execute tasks or keep promises at distributed places and times:
You tell CFEngine what and how with the details of a promise.
You tell CFEngine where and when promises should be kept, using classes.
CFEngine is designed principally to maintain desired state on a continuous basis. There are three cases for job scheduling:
Unique jobs run once and only once.
Standard jobs run sporadically on demand.
Standard jobs run on a regular schedule.
This list transfers to workflow processes too. If one job needs to follow after another (because it depends on it for something), we can ask if this workflow is a standard and regular occurrence, or a one-off phenomenon.
In CFEngine, you code a one-off workflow by specifying the space-time coordinates of the event that starts it. For example, if you want a job to be run a 16:45 on Monday 24th January 2012, you would make a class corresponding to this time, and place the promise of a job (or jobs) in this class. Let's look at some examples of this, in which host1 executes a command called my_job, and host2 follows up with a bundle of promises afterwards.
The simplest case is to schedule the exact times.
bundle agent workflow_one
{
methods:
Host2.Day24.January.Year2012.Hr16.Min50_55::
"any" usebundle => do_my_job_bundle;
commands:
Host1.Day24.January.Year2012.Hr16.Min45_50::
"/usr/local/bin/my_job";
}
Host1 runs its task at 16:45, and Host2 excutes its part in the workflow five minutes later. The advantage of this approach is that no direct communication is required between Host1 and Host2. The disadvantage is that you, as the orchestrator, have to guess how long the jobs will take. Moreover Host2 doesn't know for certain whether host1 succeeded in carrying out its job, so it might be a fruitless act.
We can change this by signalling between the processes. Whether not you consider this an improvement or not depends on what you value highest: avoidance of communication or certainty of outcome. In this version, we increase the certainty of control by asking the predecessor or upstream host for confirmation of success if the job was carried out.
bundle agent workflow_one
{
classes:
Host2::
"succeeded" expression => remoteclassesmatching
(
"did.*", # get classes matching
"Host1", # from this server
"no", # encrypt comms?
"hostX" # prefix
);
methods:
Host2.hostX_did_my_job
"any" usebundle => do_my_job_bundle;
commands:
Host1.Day24.January.Year2012.Hr16.Min45_50::
"/usr/local/bin/my_job",
classes => state_repaired("did_my_job");
}
In this example, the methods promise runs on Host2 and the commands promise runs one Host1 as before. Now, host 1 sets a signal class ‘did_my_job’ when it carries out the job, and Host2 collects it by contacting the cf-serverd on Host1. Assuming that Host1 has agreed to let Host2 know this information, by granting access to it, Host2 can inherit this class, with a prefix of its own choosing. Thus is transforms the class ‘did_my_job’ on Host1 into ‘hostX_did_my_job’ on Host2.
The advantage of this method is that the second job will only be started if the first completed, and we don't have to know how long the job took. The disadvantage of this is that we have to exchange some network information, and this has a small network cost, and requires some extra configuration on the server side to grant access to this context information:
bundle server access_rules
{
access:
"did_my_job"
resource_type => "context",
admit => { "Host2" };
}
To make a job happen at a specific time, we used a very specific time classifier ‘Day24.January.Year2012.Hr16.Min45_50’. If we now want to make this workflow into a regular occurrence, repeating at some interval we have two options:
We repeat this at the same time each week, day, hour, etc.
We don't care about the precise time, we only care about the interval between executions.
The checking of promises in CFEngine is controlled by classes and by ifelapsed locks, which may be used for these two cases respectively. If nothing else is specified, CFEngine runs every 5 minutes and reconsiders the state of all its active promises. To be specific about the time, we just alter which promises are active at different times. Classes (as used already) allow us to anchor a promise to a particular region of time and space. Locks, on the other hand, allow us to say that a promise will only be rechecked if a certain time has elapsed since the last time.
So, to make a promise repeat, we simply have to be less specific about the time. Let us make the promise on Host1 apply every day between 16:00:00 (4 pm) and 16:59:59, and add an ifelapsed lock saying that we do not want to consider rechecking more often than once every 100 minutes (more than 1 hour). Now we have a workflow process that starts at 16:00 hours each day and runs only once each day.
bundle agent workflow_one
{
classes:
Host2::
"succeeded" expression => remoteclassesmatching(
"did.*",
"Host1",
"no",
"hostX"
);
methods:
Host2.hostX_did_my_job
"any" usebundle => do_my_job_bundle;
commands:
Host1.Hr16::
"/usr/local/bin/my_job",
action => if_elapsed("100"),
classes => state_repaired("did_my_job");
We could try to be fancy about distributed scheduling, packaging it into a reusable structure. This may or may not be a good idea, depending on your aesthetics. The following example, from the community unit tests, shows how we might proceed.
body common control
{
bundlesequence => { job_chain("Hr16.Min10_15") };
}
########################################################
bundle common g
{
vars:
# Define the name of the signal passed between hosts
"signal" string => "pack_a_name";
}
########################################################
bundle agent job_chain(time)
{
vars:
# Define the names of the two parties
"client" string => "downstream.exampe.org";
"server" string => "upstream.example.org";
classes:
# derive some classes from the names defined in variables
"client_primed" expression => classmatch(canonify("$(client)")),
ifvarclass => "$(time)";
"server_primed" expression => classmatch(canonify("$(server)")),
ifvarclass => "$(time)";
client_primed::
"succeeded" expression => remoteclassesmatching(
"$(g.signal)",
"$(server)",
"yes",
"hostX"
);
methods:
client_primed::
"downstream" usebundle => do_job("Starting local follow-up job"),
action => if_elapsed("5"),
ifvarclass => "hostX_$(g.signal)";
server_primed::
"upstream" usebundle => do_job("Starting remote job"),
action => if_elapsed("5"),
classes => state_repaired("$(g.signal)");
reports:
!succeeded::
"Server communication failed",
ifvarclass => "$(time)";
}
#########################################################
bundle agent do_job(job)
{
commands:
# do whatever...
"/bin/echo $(job)";
}
#########################################################
# Server config
#########################################################
body server control
{
allowconnects => { "127.0.0.1" , "::1" };
allowallconnects => { "127.0.0.1" , "::1" };
trustkeysfrom => { "127.0.0.1" , "::1" };
allowusers => { "mark" };
}
#########################################################
bundle server access_rules()
{
access:
"$(g.signal)"
resource_type => "context",
admit => { "127.0.0.1" };
}
In the examples above, we only had two hosts cooperating about jobs. In general, it is not a good idea to link together many different hosts unless there is a good reason for doing so. In HPC or Grid environments, where distributed jobs are more common and results are combined from many sub-tasks, one typically uses some more specialized middleware to accomplish this kind of cooperation. Such software makes compromises of its own, but is generally better suited to the specialized task for which it was written than a tool like CFEngine (whose main design criteria are to be secure and generic).
Nevertheless, there are some tricks left in CFEngine for distributed scheduling if we want to trigger a number of follow-ups from a single job, or aggregate a number of jobs to drive a single follow-up.

When aggregating jobs, we must combine their exit status using AND or OR. The most common case it that we require all the prerequisites in place in order to generate the final result, i.e. trigger the followup only if all of the prerequisites succeeded.
bundle agent workflow_one
{
vars:
"n" slist => { "2", "3", "4" };
classes:
"succeeded$(n)" expression => remoteclassesmatching(
"did.*",
"Host$(n)",
"no",
"hostX"
),
ifvarclass => "Host$(n)";
methods:
Host2.Host3.Host4.hostX_did_my_job
"any" usebundle => do_my_job_bundle;
commands:
Host1.Hr16::
"/usr/local/bin/my_job",
action => if_elapsed("100"),
classes => state_repaired("did_my_job");
}
This example shows an all-or-nothing result. The follow-up job will only be executed if all three jobs finish within the same 5 minute time-frame. There is no error handling or recovery except to schedule the whole thing again.
Triggering from one or more predecessors, i.e. combining with OR, looks similar, we just have to change the class expression:
bundle agent example
{
methods:
(Host2|Host3|Host4).hostX_did_my_job
"any" usebundle => do_my_job_bundle;
}
The converse scenario is to trigger a number of jobs from a single pre-requisite. This is simply a case of listing the jobs under the trigger classes.
bundle agent workflow_one
{
classes:
Host2::
"succeeded" expression => remoteclassesmatching(
"did.*",
"Host1",
"no",
"hostX"
);
methods:
Host2.hostX_did_my_job
"any" usebundle => do_my_job_bundle1;
"any" usebundle => do_my_job_bundle2;
"any" usebundle => do_my_job_bundle3;
commands:
Host1.Hr16::
"/usr/local/bin/my_job",
action => if_elapsed("100"),
classes => state_repaired("did_my_job");
To apply CFEngine's self-healing concepts to workflow scheduling, we can imagine the concept of a convergent workflow, i.e. one that, if we repeat everything a sufficient number of times, will eventually lead to the result. The outcome of the chained sequence of jobs must have an outcome that is repeatably achievable and which will eventually be achieved if we try a sufficient number of times. Using CFEngine this is a natural outcome – however, most system designers do not think in terms of repeatable sustainable outcomes and fault-tolerance.
Beware however, one-off jobs cannot be made convergent, because they only have a single chance to succeed. It is a question of business process design whether you design workflows to be sustainable and repeatable, or whether you trust the outcome of a single shot process. Using the persistent classes in CFEngine together with the if-elapsed locks to send signals between hosts, it is simple and automatic to make convergent self-healing workflows.
Long workflow chains are those which involve more than one trigger. These can be created by repeating the pattern above several times. Note however, that each link in the chain introduces a new level of uncertainty and potential failure. In general, we would not recommend creating workflows with long chains.
Distributed scheduling is about tying together jobs to create a workflow across multiple machines. It introduces a level of fragility into system automation. Using CFEngine promises, we can create self-healing workflows, but we recommend minimizing dependencies. This document shows how to build workflows using CFEngine primitives.
Prototype: getgid(groupname)
Return type: int
Description: Return the integer group id of the group groupname on this
host.
If the named group does not exist, the function will fail and the variable will not be defined.
Arguments:
groupname: string, in the range: .*Example:
body common control
{
bundlesequence => { "example" };
}
bundle agent example
{
vars:
linux|solaris|hpux::
"gid" int => getgid("root");
freebsd|darwin|openbsd::
"gid" int => getgid("wheel");
aix::
"gid" int => getgid("system");
reports:
"root's gid is $(gid)";
}
Output:
R: root's gid is 0
Notes: On Windows, which does not support group ids, the variable will not be defined.