
“A model is a lie that helps you to see the truth.” (Howard Skipper)
“There is nothing more practical than a good theory.” (Kurt Lewin)
The past year has seen a plethora, one might even say an entire movement, of talks and blog posts under the heading “Monitoring Sucks”. Plenty of valid criticisms have been made about the state of the art in monitoring. Back in 1998, I was similarly dissatisfied with the state of the art, and began to ask some basic questions that resulted in CFEngine’s present day tools for system monitoring. This article is a reminder of CFEngine’s smart, and extremely lightweight tools for de-centralized monitoring. These tools were designed to be adaptable, hands-free and to scale to tens of thousands of hosts, while handling machine-learning pattern matching, and responding automatically to thresholds and anomalies with minimal latency, with or without human intervention.
An anecdote
Merely integrating configuration management with arbitrary monitoring software will not necessarily lead to a useful system.
I recall an episode, not many years ago, where a couple of student interns at different companies were trying to monitor web statistics on a web server farm. They both did exactly the same thing: they installed a popular open source monitoring tool and started collecting graphs. Because they were inexperienced, and didn’t know what to look for, they chose system load from one of the outputs. What they found was a series of sharp peaks in the system load at regular intervals. At first they presented this result without question, but quickly realized that this did not make sense, as it disagreed with web server logs. Finally after digging around, they realized that the sharp spikes were the monitoring system itself kicking in and setting off hundreds of shell commands to probe the system. The monitoring system had achieved a perfect state of staring itself in the mirror of its own activity. The data were not disputed, but the result meant nothing as far as the web service was concerned.
Werner Heisenberg made the point during the last century that the act of observing a system requires us to disturb it. If the disturbance we introduce is greater than the phenomenon itself, then we simply cannot observe it, no matter how much we might like to.
Theory - or what’s in a model
Over the years, I’ve seen a lot of suggestions about how to collect and analyze data streams. Because we have a desire to “know” answers, there is a natural instinct to collect data from trusted sources. The question is: what sources do we trust, and why do we believe their integrity?
Years ago, I worked with a space science department who collected satellite data. They spent so much time accumulating data that they were never able to analyze everything they collected. The result was a large cost and no result. By the time they considered analyzing the data, they were already irrelevant.
On a more mundane level, our desire to know about the stars of Hollywood might lead us to study gossip rags or studio press releases. Which will give us the insight we need? Our desire to understand computers in our organization might lead us to SNMP or vmstat. Which of these do we choose? What do we trust?
Science has a simple answer to this. You can’t trust any source more than any other, a priori, unless you have some kind of a model in your mind of what it is you are looking for. That is the first step to evaluating whether the data you receive make sense.
| A model is a set of assumptions and expectations, formalized in some way. |
We see almost no mention of models in system monitoring. We are lucky if the axes of graphs are labelled with some kind of scale and units that indicate what we are looking at. With the occasional exception of some curve-fitting algorithms, modelling seems to be the undiscovered country of measurement. That is because there is weak integration between data sources and data rendering tools.
A model, or a theory, is an idea about what to expect when you observe the world. For some reason, the idea of theory has been seen as the opposite of practice in recent times (something to be derided), but this is an unfair judgement, usually promulgated by those with a chip on their shoulder. The fact is that no one can do without a theory when they interpret data. The real question is how consistent are we in doing so?
Data versus meaning: admitting to uncertainty
All knowledge is subject to uncertainty. A useful way to think about this, is the simple model (self-reference intended) known as the The DIKW hierarchy. When we look at the world, we collect Data, often with limited reliability, and limited fidelity. Data are just values that mean nothing in isolation – nothing until you put it into some kind of context with a model. For example, you learn that the weights of three people are 65, 70 and 20. What does this tell us? Very little. There are some differences in the numbers, but we don’t know the cause. If the units are in kilogrammes, this could be two adults and a child, or it could be two overweight kids and an adult suffering from malnutrition. Three children, two with heavy shopping?
Unless we state our assumptions and expectations, there is no way to interpret data. Ideally, the context would be presented along with the data so that we have something to compare the new data to. In computer monitoring, it is common to assume everything and state nothing. This can be based on past experience, or simply on speculation – but our eventual estimate of uncertainty depends on this. The chief lesson of science is that there is always uncertainty, and we have to manage this.
At this point, context and model make data information. If you can assimilate this and re-use it, it becomes knowledge. Wisdom is something I personally see as being something we aspire to down-the-line: an asymptote to be approached by the paradox of Zeno. DIWK.
Presenting information instead of data
Monitoring tools today throw data at humans, and expect us to make sense of them. Humans dutifully stare at moving traces and waste expensive hours in one of a number of time wasting activities:
- Staring at the data, as if it were reality TV (without aim).
- Investigating things that look unexpected (with inconsistent aims).
- Comparing data to past behaviour and relating it to causes (manual analysis).
- Trying to analyze the data using other tools (searching for meaning).
As I was developing techniques for monitoring in CFEngine to fulfil the idea of self-regulation, I asked the simple question: is it possible for the tools to assist the humans rather than the other way around?
Now, CFEngine’s goal was never to be a monitoring tool, per se. But it was clear from the research that monitoring and system configuration need one another. (Today, Open Source is both a blessing and a curse in this matter: it is a blessing because we can get almost anything to play with, but it is a curse because Open Source projects have become strong brands that people don’t want to mix together. Merging monitoring and configuration is considered heretical by many due to brand loyalty.) I began by studying computers in action to see what they did (see Measuring Host Normality (2000-2002)), like Sir David Attenborough filming animals in the wild. In computing, one generally begins with the naive assumption that computers do what we told them, but that is naive indeed: we know that they do all kinds of things that we never told them to also.
Amongst the key observations were the following points:
- Computers only behave predictably if they are busy.
- Computers are busy when people use them.
- Computer activity is driven by the patterns of the human working week.
The last of these points was a significant result: performance statistics have a strong periodic pattern, that peaks once per day for each day of the week. The largest peaks are usually early in the week, and they fall off towards the weekend. Sound familiar?
The figure shows a typical pattern for a busy web-server, measured over several months, but with each successive week overlaid on the previous ones, so that the time scale is measured from Monday at 00:00 and ends on Sunday at 24:00. The points are the average over all weeks, and the vertical bars (what scientists call error bars) show the standard deviation, which is an order of magnitude estimate of the “uncertainty” or spread of the values.
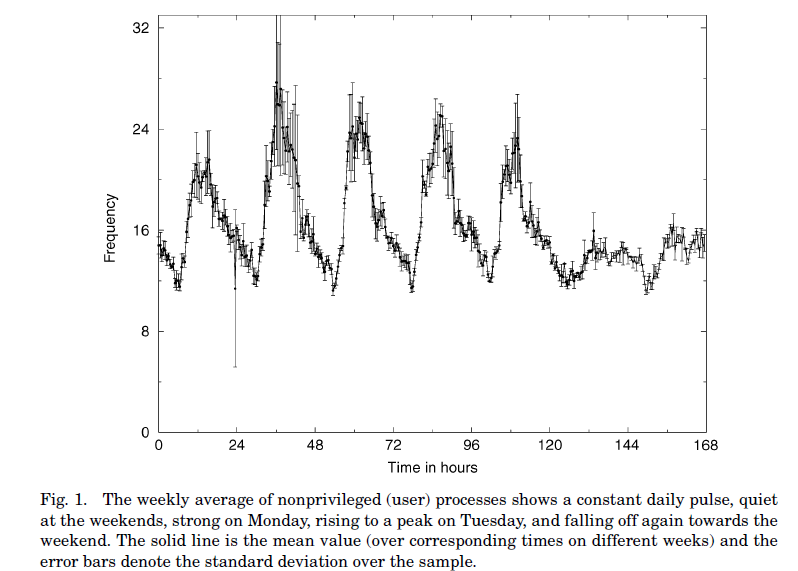
The daily peaks are evident. But notice also the “error bars” which represent how much variation there is in the signal. These are small compared to the pattern itself. If that were not the case, any pattern we managed to see would merely be fiction, like faces in clouds.
These early studies led to a stochastic model of computers in an environment of users, based on well known methods from physics (see The Kinematics of Distributed Computing) that gave a measure of understanding as to why the data looked like this, and eventually it led to a simple reformulation of that model into cylindrical time coordinates (see Two dimensional time-series for anomaly detection and regulation in adaptive systems), so that we could factor out the trend of the week.
The importance of the result was to confirm that it makes sense to store what happened in the past and compare it to what is happening now, because there is a repeated pattern. If a system never behaved the same way twice, nothing we see in the data (beyond increasing and decreasing) can mean anything. On busy systems, this pattern is significant enough to have meaning. On desktops and occasionally used servers, the pattern is simply noise, and every new event is an anomaly, as you might expect of something that is completely irregular. This picture makes sense, and allows us to trust what we are seeing. So why not make tools that present measured data in the context of this established model? Then we would immediately have a notion of what is normal (i.e. expected) and that is potentially interesting. Moreover, this determination can be completely automated and used to decide on what actions as a matter of policy. This is what CFEngine did.
Self-regulation strengthens measured patterns by linking desired and actual state
In 1998, I introduced the idea of Computer Immunology, suggesting that in order to make systems self-healing and autonomically adaptive, it was necessary to tie model-based monitoring to configuration systems. The Computer Immunology paper laid out a manifesto for research, which ultimately turned into a series of technical papers, proofs and implementations in CFEngine versions 2 and 3. The fruits of that research led to some very simple and efficient ways of filtering meaningful information from useless noise.
The situation is analogous to configuration by scripts of relentless shell commands, and model-based configuration where there is a policy that describes desired state. Indeed, to know about a self-regulating system, there are two parts
If these things do not match, what are you going to do about it? Well that’s up to you.
Big data and brute force
Today, I see that we are tempted by the allure of technologies to store large amounts of data. We have Big Data Envy of sites like Google and Amazon that have genuine needs to store large data. Some are suggesting that we should store every possible bit of data and simply search it. This was the CMDB dream, put forward mainly by large database manufacturers. Of course, it is a ridiculously inefficient way to approach measurement of a system that has a known purpose. It increases cost, scales poorly and it is literally meaningless to do so.
If we want data to be relevant information, then we should be looking for ways to reduce the amount by factoring out expected signals from noise, not collecting more just because we can. If we know there is nothing to find in more data, there is no sense in collecting it. Increasing the amount of data does not necessarily increase your certainty, or the ability to determine cause-effect relationships.
My personal view is that even curve-fitting or regression analysis of data (the love child of Gaussian statistics and spline fitting) is also a waste of time, as it introduces new uncertainties and characterization of observed deviations is a more honest tool that can easily be inspected by human judgement, without taxing anyone’s brain. Anyway, computer statistics are rarely Normally distributed.
Separation of fast and slow-moving variables (sometimes called de-trending) is a more useful standard technique for finding the “tides” of system behaviour, and this allows us to see signal from noise. When dealing with cumulative measures, like disk usage, the patterns are in deltas or rate of change. A complete description of a dynamical system can be found by measuring values and rates of change (called the phase-space of the system) over time.
CFEngine’s cf-monitord and vital signs: certainty, repeatability and forgetting the past
CFEngine’s monitoring was originally an experimental idea, but it has proven very useful, and it still has a unique point of view.
The key to making sense of our computers is to repeat measurements and look for patterns. Merely collecting reams of time series graphs going far back in time does not allow us to see such patterns clearly. Humans can only perceive small amounts of data at a time. The tools should help us to do this, and present humans with information which accelerates their decision making rather than wasting their time with manual analysis or even guesswork.
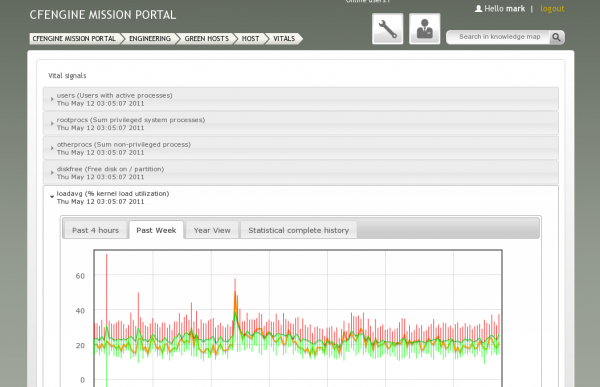
A CFEngine weekly trend graph, showing the current values, average over months and envelope of uncertainty.
A key design feature was to make cf-monitord almost unmeasurable in its load to the system. It uses direct system probes through the POSIX library to access data, and matches using regular expressions to offer a very flexible interface to gather almost any kind of data and analyze it before handing it over as contextualized information. In this way, it does not waste system resources, or human resources.
In a similar way, it does not store endless amounts of data. Due to a clever machine-learning trick, using geometric series, only one week’s worth of data are needed to achieve
- Latest measured value over the past week.
- Weighted average for current 5 minute interval going back several months (tunable) that progressively demotes and forgets old data.
- Rate of change.
- Estimated uncertainty (reliability) in the data for any 5 minute interval in a week.
All that adds up to just a few megabytes per machine for around 50-100 metrics.
# Example promise to measure failed logins by ftp every 60 mins bundle monitor custom_measures { measurements: "/var/log/messages" # read from any source, avoid pipes to stay light handle => "ftp_failed_anonymous_login", stream_type => "file", data_type => "counter", match_value => scan_log(".*ftpd\[.*", ".*ANONYMOUS FTP LOGIN REFUSED.*"), history_type => "log", action => sample_rate("60"); # .... }Understanding how often data need to be measured is straightforward: Nyquist’s theorem (Fourier analysis) tells us that we need to sample at about twice the rate of the fastest change to capture its behaviour. If a process is changing quickly, we need to sample often. If it is changing slowly, it is just wasting time and resources to sample it more often than that (see Ten Reasons for 5-minute configuration update and repair).
Anomalies and alerts
The CFEngine way is to classify the actual state of your system and then work towards a desired state, based on information relative to a clear predictable model. Even after 10 years, this is surprisingly new in concept. In classifying promised measurements, CFEngine feeds back information that can be used to respond to what is going on. Each measurement type, labelled by its handle (in the example above) sets classes about how the current state matches the learned periodogram model.
As well as checking for fixed thresholds, you can characterize the state of your system relative to what is normal. The possibilities here are very extensive, and there is no room to describe them here.
bundle agent followup { reports: www_in_high_dev2:: "Incoming web hits is 2 stddev above normal for this time: $(sys.date)"; # print more data / logs / IP addresses etc }A complete list of these class types is described in the documentation (see references at the end of this article).
Give it a try
Running CFEngine’s monitoring subsystem is virtually free in terms of system resources. If you use CFEngine Enterprise edition, you will have data presented to you in a maximally meaningful way, and will be able to respond to it manually or automatically in a minimum of time.
Centralized measurement systems, like SNMP, add significant uncertainty to data, as we do not know exactly when data were collected due to latencies. It also chokes the network with unnecessary traffic (most of which is meaningless). CFEngine collects all data locally and extracts meaningful patterns before allowing them to be aggregated for cross-machine comparisons, so there is greater consistency and distributed processing to minimize load. CFEngine’s monitoring is not centralized, but distributed. As much analysis as possible is done by machine learning agents on individual hosts, so that latencies and uncertainties are kept to a minimum.
The goal of monitoring in CFEngine is whatever you want it to be. It can replace systems like Nagios, Munin or Ganglia etc, for many purposes, but it doesn’t have to. Choosing tools is not always a rational matter, but if your system is massive and busy, then there is great scope in the tools provided. Check it what is probably the lightest weight monitoring scheme available, and tie it to real-time configuration management as you like.
Read more
Special Topics Guide on Monitoring: log management and anomaly detection.


