This post was authored by Aleksey
Tsalolikhin
and has been
re-published
with his consent. I recently spoke at Digital Media Educators
Conference (DMEC) on Infrastructure
Management at Scale and the skills educators need to impart to up and
coming system administrators. This conference serves the California
community college system, which is dear to my heart. My mother worked at
West Los Angeles College library her entire
professional life in America, since we arrived in 1988. I used to
volunteer and help her out with shelving in the summer. I was a very
poor helper since I kept getting distracted by all the delicious books
and did more reading than shelving. While in high school I took computer
programming, math and English at West Los Angeles College and at Santa
Monica Community College, at first during summer break and then
concurrent with eleventh grade, which allowed me to go to University
instead of going to 12th grade. So I have a personal connection to the
California community college system and I jumped at the chance to
contribute a talk:
 Because my presentation was in the Data
Representation
track, I focused on Inventory and Compliance Reporting so I could show
off CFEngine’s slick UI. I started by laying out CFEngine’s philosophic
groundwork: - Promise
Theory and the advantages
of voluntary cooperation and distributed work over the limitations of
imposed direct control. - The advantages of pull over push (see “Push
versus pull” in Deconstructing the `CAP theorem’ for CM and
DevOps by the author of CFEngine
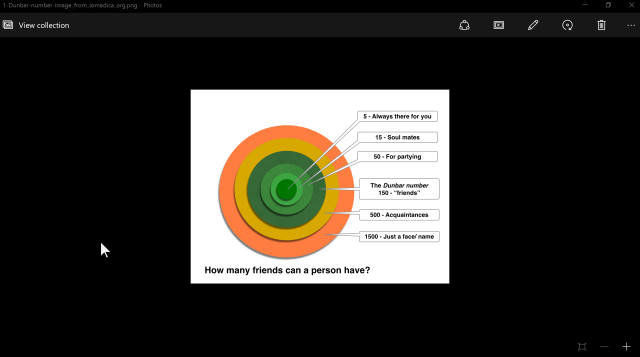
for more on this), and - The Dunbar
numbers which
constrain the quality and quantity of relationships sysadmins are able
to have with their infrastructures. The rest of the talk demonstrated
how the design of CFEngine uses Dunbar numbers to focus the information
it presents.
Because my presentation was in the Data
Representation
track, I focused on Inventory and Compliance Reporting so I could show
off CFEngine’s slick UI. I started by laying out CFEngine’s philosophic
groundwork: - Promise
Theory and the advantages
of voluntary cooperation and distributed work over the limitations of
imposed direct control. - The advantages of pull over push (see “Push
versus pull” in Deconstructing the `CAP theorem’ for CM and
DevOps by the author of CFEngine
for more on this), and - The Dunbar
numbers which
constrain the quality and quantity of relationships sysadmins are able
to have with their infrastructures. The rest of the talk demonstrated
how the design of CFEngine uses Dunbar numbers to focus the information
it presents.
 We also talked about what computer system administration
IS, and what the challenges are
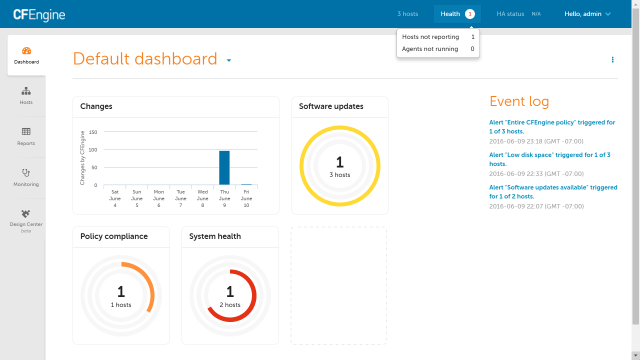
and how we handle them. Then I introduced the CFEngine dashboard:
We also talked about what computer system administration
IS, and what the challenges are
and how we handle them. Then I introduced the CFEngine dashboard:
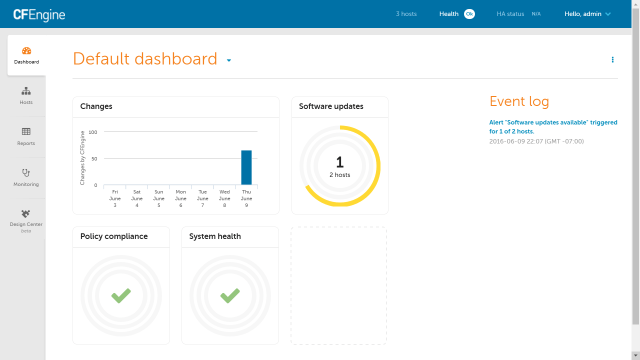
 I pointed out the header which holds the host count (2, including the
hub itself) and the health indicator (OK); the graph of Changes made by
CFEngine, the fact that both of our hosts have Software Updates
available (1 alert triggered on 2 hosts), and that we have 100%
compliance on promise compliance and system health (green check-marks).
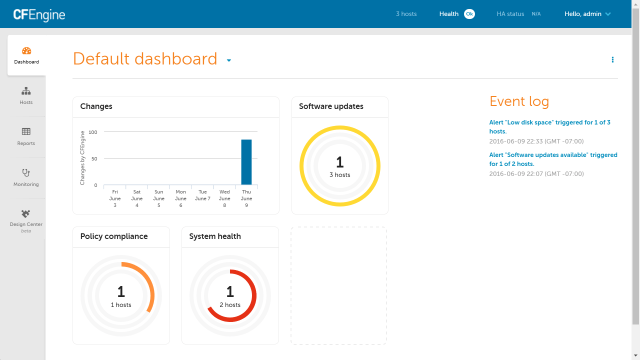
The next slide, adding a third host (notice the hosts indicator up top),
shows how the Alert for Software Updates changes to a 2/3 arc, as, right
after adding the host, as at this point the hub knows 2 out of 3 hosts
are missing software updates. Once the agent runs on the third host and
the hub collects the report, the Alert will change back to a full circle
with 3 out of 3 hosts are missing software updates.
I pointed out the header which holds the host count (2, including the
hub itself) and the health indicator (OK); the graph of Changes made by
CFEngine, the fact that both of our hosts have Software Updates
available (1 alert triggered on 2 hosts), and that we have 100%
compliance on promise compliance and system health (green check-marks).
The next slide, adding a third host (notice the hosts indicator up top),
shows how the Alert for Software Updates changes to a 2/3 arc, as, right
after adding the host, as at this point the hub knows 2 out of 3 hosts
are missing software updates. Once the agent runs on the third host and
the hub collects the report, the Alert will change back to a full circle
with 3 out of 3 hosts are missing software updates.
 The next slide illustrates how CFEngine communicates the severity
of the alert: critical issues are indicated in red, less severe in
orange (amber for you Aussies), and mildest level is yellow. I induced a
policy non-compliance situation on one of the three hosts (e.g.,
promised a file edit but prevented CFEngine from accessing the file by
filling up the disk), so the Promise Compliance alert spans 1/3 of the
circle (1 out of 3 hosts).
The next slide illustrates how CFEngine communicates the severity
of the alert: critical issues are indicated in red, less severe in
orange (amber for you Aussies), and mildest level is yellow. I induced a
policy non-compliance situation on one of the three hosts (e.g.,
promised a file edit but prevented CFEngine from accessing the file by
filling up the disk), so the Promise Compliance alert spans 1/3 of the
circle (1 out of 3 hosts).
 Notice also that if CFEngine is unable to collect reports from a host
or if an agent stops running on a host, the health indicator at the top
of the screen changes from OK to a red number indicating the number of
issues:
Notice also that if CFEngine is unable to collect reports from a host
or if an agent stops running on a host, the health indicator at the top
of the screen changes from OK to a red number indicating the number of
issues:
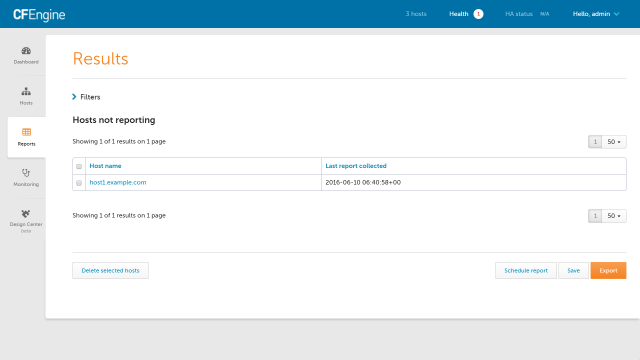
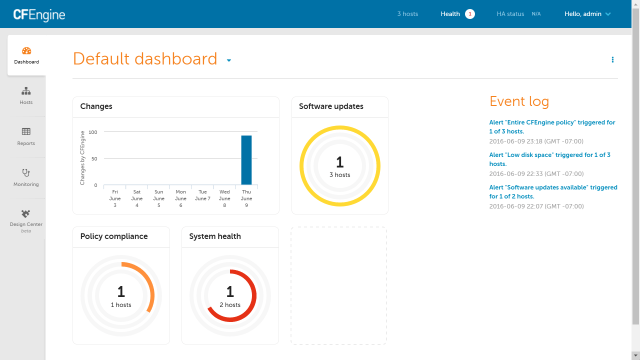 You can see the number and type of issues:
 Notice that the Dunbar numbers are in play here: CFEngine tells you
there are issues, and if you want more data, then you can have it. But
it doesn’t throw all the detail at you at once, that would be too much.
You can get more detail on which hosts are not reporting by selecting
“Hosts not reporting” from the health indicator menu:
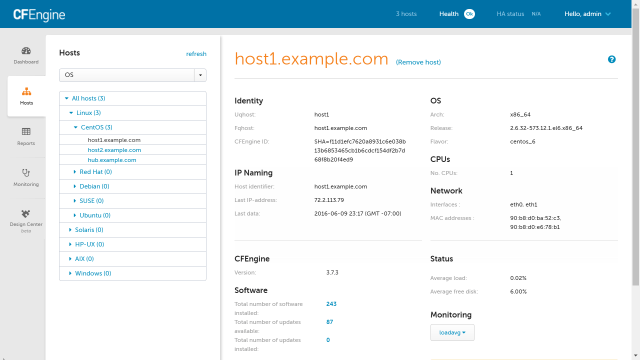
You can then select a host in the list of hosts not reporting to see the
info for that host (host detail).
Notice that the Dunbar numbers are in play here: CFEngine tells you
there are issues, and if you want more data, then you can have it. But
it doesn’t throw all the detail at you at once, that would be too much.
You can get more detail on which hosts are not reporting by selecting
“Hosts not reporting” from the health indicator menu:
You can then select a host in the list of hosts not reporting to see the
info for that host (host detail).
 That actually takes us to the “Hosts” tab. The “Hosts” tab starts in the
“all hosts” view, where you see the promise compliance summary for your
infrastructure:
That actually takes us to the “Hosts” tab. The “Hosts” tab starts in the
“all hosts” view, where you see the promise compliance summary for your
infrastructure:
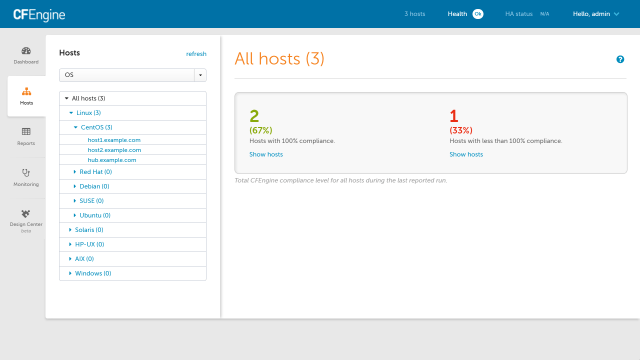 You can list the hosts that have less than 100% compliance:
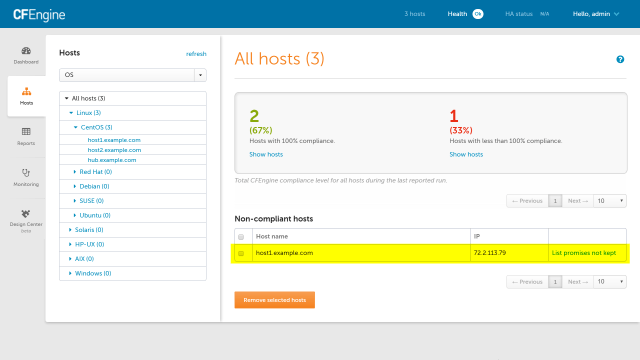 You can see which promises were not kept on each host:
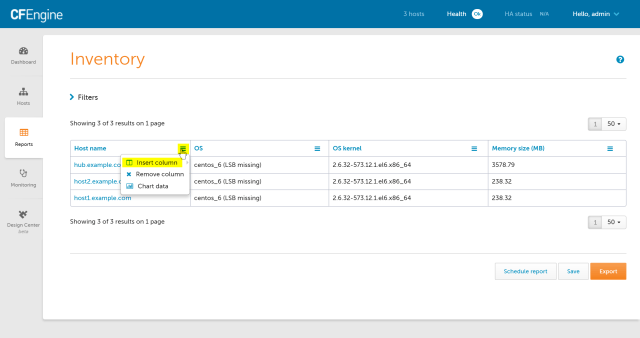
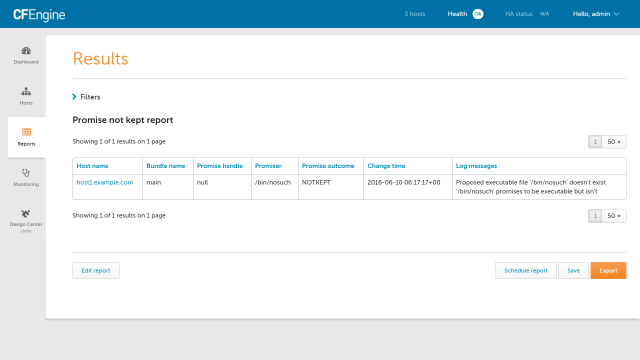 And that takes us to the “Reports” tab. There are many reports available
but let’s take a look at the Inventory Report. It starts out with four
basic columns but you can add more:
And that takes us to the “Reports” tab. There are many reports available
but let’s take a look at the Inventory Report. It starts out with four
basic columns but you can add more:
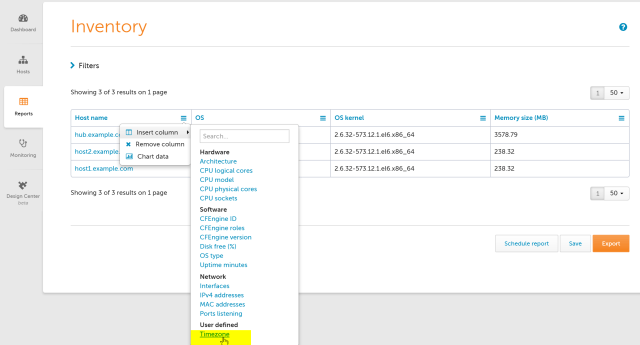
 You can extend inventory collection by writing CFEngine promises, for
example, here I’ve added inventory of the host’s timezone:
You can extend inventory collection by writing CFEngine promises, for
example, here I’ve added inventory of the host’s timezone:
 Let’s say our company policy says all hosts must be in the UTC timezone.
But in reality we have this:
Let’s say our company policy says all hosts must be in the UTC timezone.
But in reality we have this:
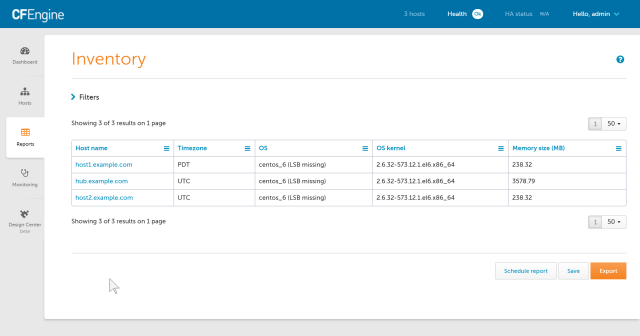 You can sort the column contents by selecting the column heading, this
groups the outliers and brings them into view:
You can sort the column contents by selecting the column heading, this
groups the outliers and brings them into view:
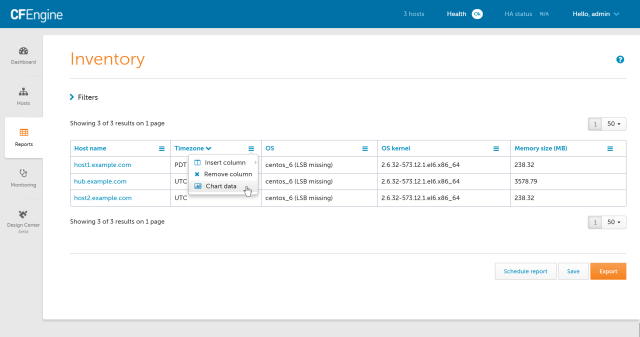
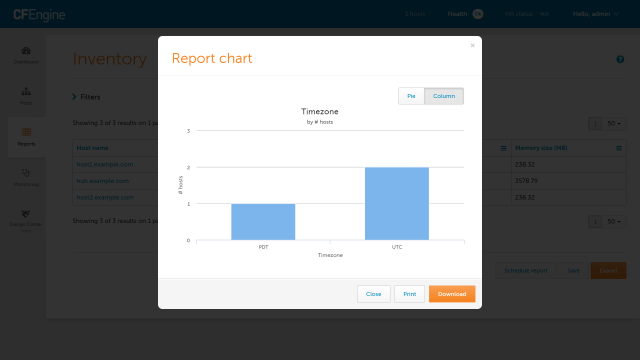
 You can graphically summarize column contents by selecting “Chart Data”:
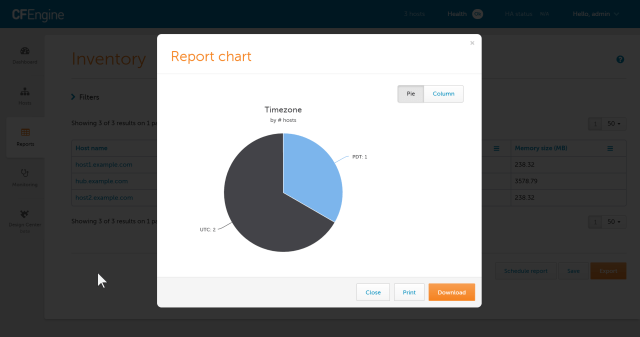
 Voila!
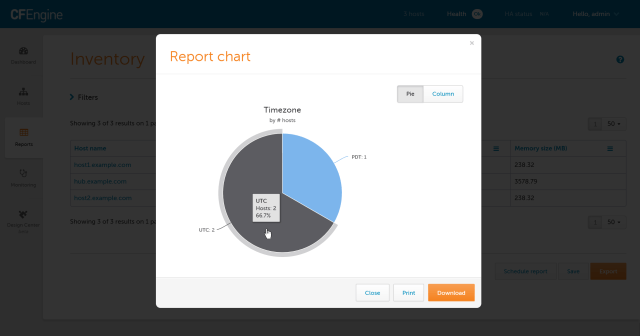
 Hover over a slice to get more detail:
 Or switch to column view:
 Here is another example:
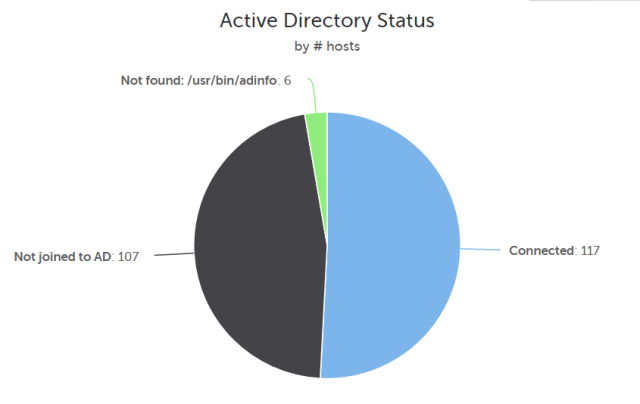 The charts can be exported and embedded in reports to management,
auditors, etc. Want to give CFEngine Enterprise a try? It’s very easy to
download and install the
hub package. Feel free to email
me if you have any questions!
The charts can be exported and embedded in reports to management,
auditors, etc. Want to give CFEngine Enterprise a try? It’s very easy to
download and install the
hub package. Feel free to email
me if you have any questions!
Infrastructure management at scale: An overview of CFEngine Enterprise

August 26, 2016
Share this


