Recently I wanted to start measuring the length of time it took for PostgreSQL to acquire a lock so that I could keep an eye on how it changes over time.
My PostgreSQL logs contain entries like the following that record the amount of time in ms it took to acquire a lock.
2019-06-11 18:49:39 GMT LOG: process 10427 acquired AccessShareLock on relation 17949 of database 16384 after 1118.396 ms at character 269Measurement promises store and track values. Values can be sampled from
either a pipe (command output) or a file as defined by the promises
stream_type. Values are stored according to the promises
history_type. When a measured value is not expected to change
frequently a history_type of scalar or static will result in the
measurement being sampled less frequently and the single value with
compressed statistics will be stored. A history_type of log results
in the measured value being logged as an infinite time-series in
$(sys.statedir)/<PromiseHandle>_measure.log. A history_type of
weekly results in the storing of a two-dimensional time average over a
weekly period. Measurements with history_type of weekly are
automatically graphed in Mission Portal if they are collected.
Measurements in CFEngine have been around for a long time, but 3.10 brought custom measurements from the closed source enterprise code base to the open source core code base.
Let’s review this policy to extract and measure ms PostgreSQL had to wait before acquiring the lock.
bundle monitor measure_psql
{
     measurements:

       am_policy_server::

       "/var/log/postgresql.log"
         handle => "psql_lock_wait_before_acquisition",
         comment => "How long psql had to wait before it acquired a lock",
         stream_type => "file",
         match_value => psql_acquired_AccessShareLock,
         data_type => "int",
         units => "ms",
         history_type => "weekly",
         if => fileexists( "/var/log/postgresql.log" );
}
Measurement promises are evaluated by cf-monitord and must reside
within monitor type bundles. Hosts that have the am_policy_server
class defined will scan the postgresql.log file, extract the value to
measure as defined by body match_value psql_acquired_AccessShareLock
and store it in a two-dimensional time average if the file exists.
The values related to this measurement are stored in the mon bundle
scope, with names based on the promise handle.
- mon.value_psql_lock_wait_before_acquisition
The last sampled value for the promise with handle
psql_lock_wait_before_acquisition. - mon.av_psql_lock_wait_before_acquisition
The average sampled value for the promise with handle
psql_lock_wait_before_acquisitionover the stored weekly history. - mon.dev_psql_lock_wait_before_acquisition
The standard deviation sampled value for the promise with handle
psql_lock_wait_before_acquisitionover the stored weekly history.
Next, lets review body match_value psql_acquired_AccessShareLock where
the details of how the sampled value is extracted from the log file
reside.
body match_value psql_acquired_AccessShareLock
# @brief Average time to successfully acquire AccessShareLock from log file
{
   select_line_matching => ".*acquired AccessShareLock.*";
   extraction_regex => ".*after (\d+)";
   track_growing_file => "true";
   select_multiline_policy => "average"; # average, sun, first, last
}
select_line_matching takes an anchored regular expression matching
lines that we should consider. extraction_regex is an unanchored
regular expression that should contain a single back-reference for
extracting the value that should be sampled. track_growing_file allows
cf-monitord to remember the position from which it last read in the file
so that the same log entries are not counted multiple times. Finally,
during each sample there may be multiple log entries recording that a
lock was acquired. We use select_multiline_policy to average the
extracted values together.
Once the policy has been running I can see the last recorded, average,
and standard deviation by running cf-promises --show-vars=psql.
[root@demohub ~]# cf-promises --show-vars=psql
Variable name Variable value Meta tags
default:mon.av_psql_lock_wait_before_acquisition 1640.40 monitoring,source=environment
default:mon.dev_psql_lock_wait_before_acquisition 0.00 monitoring,source=environment
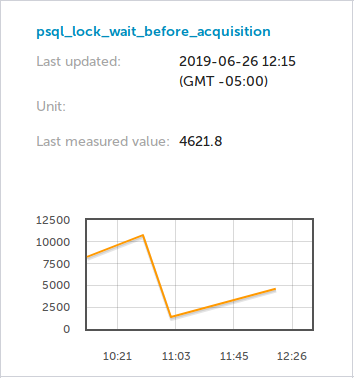
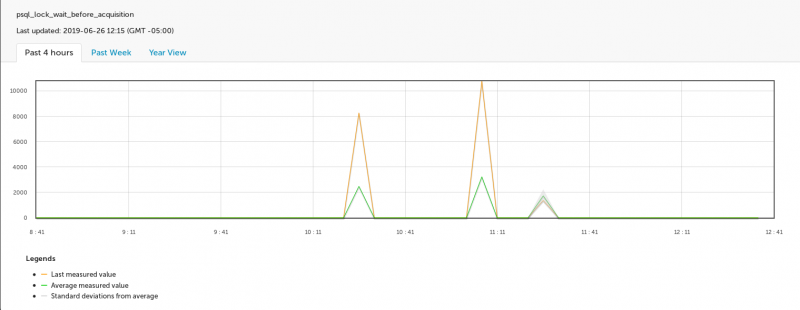
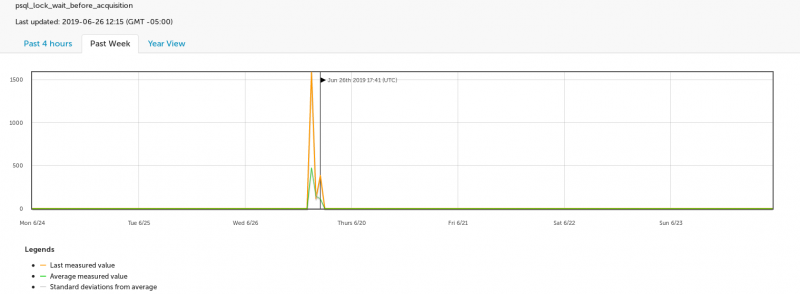
default:mon.value_psql_lock_wait_before_acquisition 5468.00 monitoring,source=environmentIn Mission Portal of CFEngine Enterprise the measurements are graphed so they can be visualized over time.